Compression Testing of Carbon Fiber Reinforced Polymer (CRFP) Tubes
This page details my engineering Capstone Project completed in Spring 2021 through the Pratt School of Engineering. The aim of this course is to develop and complete a design project, and develop learning modules which capture specific skills and topics relevant to the project.
Introduction
As a passionate cyclist and naturally curious engineer, I focused my project scope on carbon-fiber manufacturing techniques, as well as materials testing and analysis.
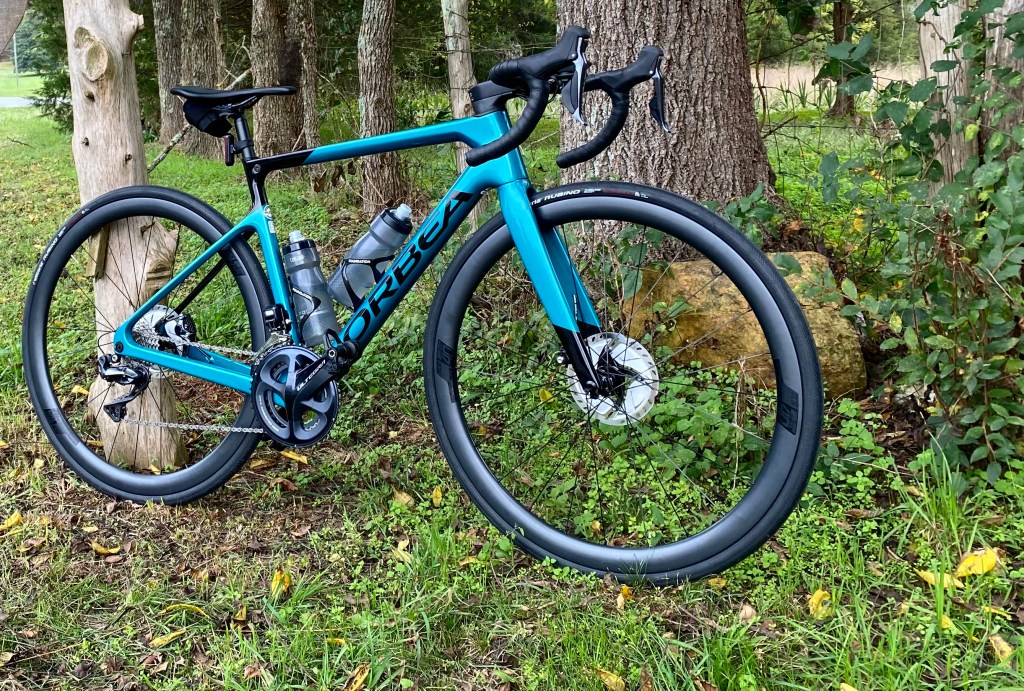
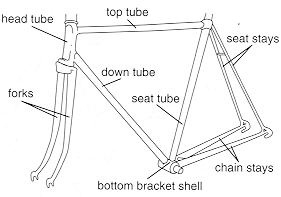
To explore these topics, I chose to replicate the top-tube of a bicycle. This is the section of a bike frame which connects the seat-tube to the handlebars, parallel to the ground.
Although the top tube is one of the simpler aspects of a bike frame, manufacturing any component from carbon fiber reinforced polymer (CRFP) significantly increases the complexity of analysis. This is due to the unique nature of composite materials.
Given the increasing emphasis in industry on the utility and strength of carbon fiber composites for automotive, aerospace, marine, and sports equipment, having a strong background in composites manufacturing techniques is necessary when trying to make positive impacts in those industries as a mechanical design engineer.
Follow along below as I describe the project background, top-tube simulations, manufacturing process, data acquisition setup, and data analysis.
Background
Mechanics of Materials
Isotropic Materials vs. Anisotropic Materials
To understand why I chose to work with carbon fiber, it is first necessary to understand the difference between isotropic and anisotropic materials. Simply put, purely isotropic materials are those which behave identically in all planes, whereas the behavior of anisotropic materials is variable and dependent on the material’s orientation. Composite materials fall into this second category, and the resulting mechanics analysis required to make predictions about behavior is significantly more complex.
Internal Forces of a Bike
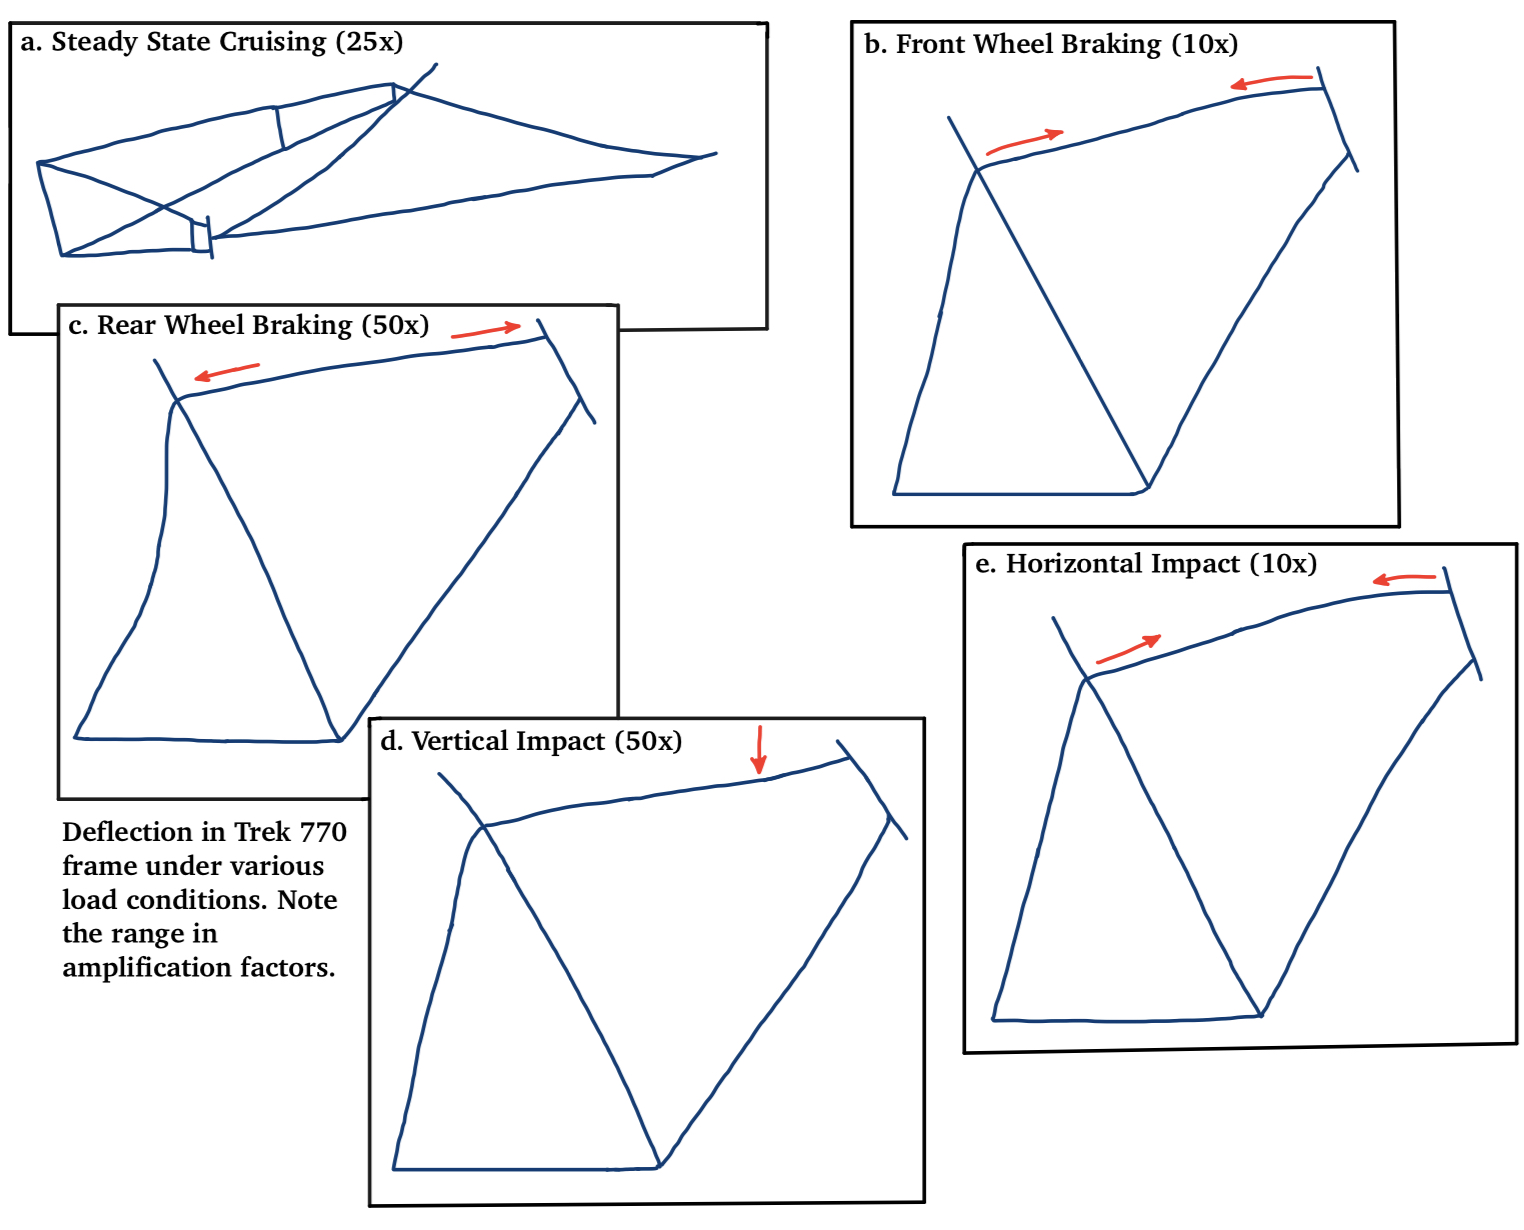
In order to develop a plan to test these top tubes, it was first crucial to understand what internal forces this component experiences as part of its regular use. The diagram on the right, adapted from a journal article written by Leisha Peterson and Kelly Londry from Pegasus Research (1986), demonstrates a few of these possible bike frame loading conditions and top tube reactions.
I chose to focus on loading condition (b) in which the top tube is put into a state of compression while the front wheel is braking. This is an extremely common repeating loading condition which does not necessarily transmit a large amount of force through the bike frame.
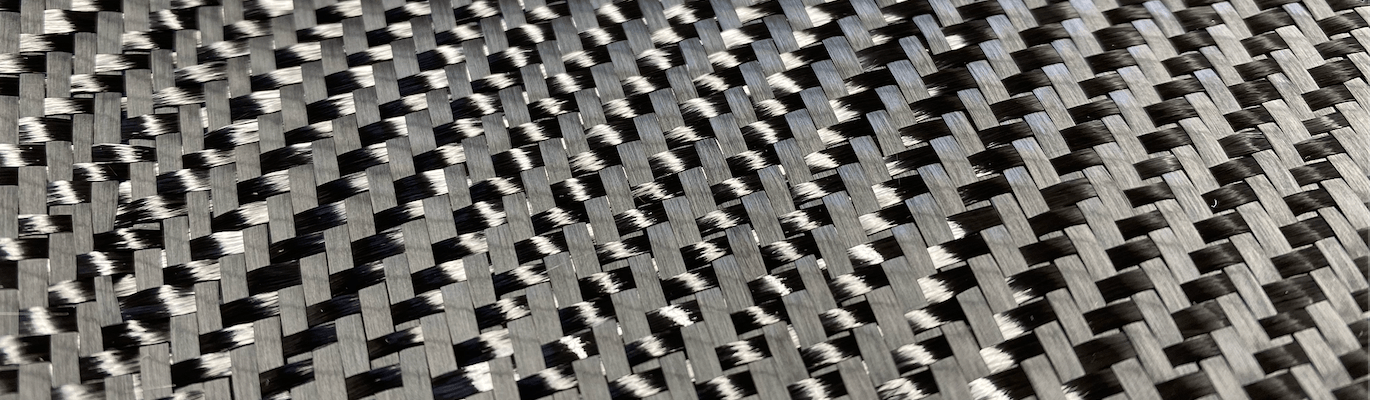
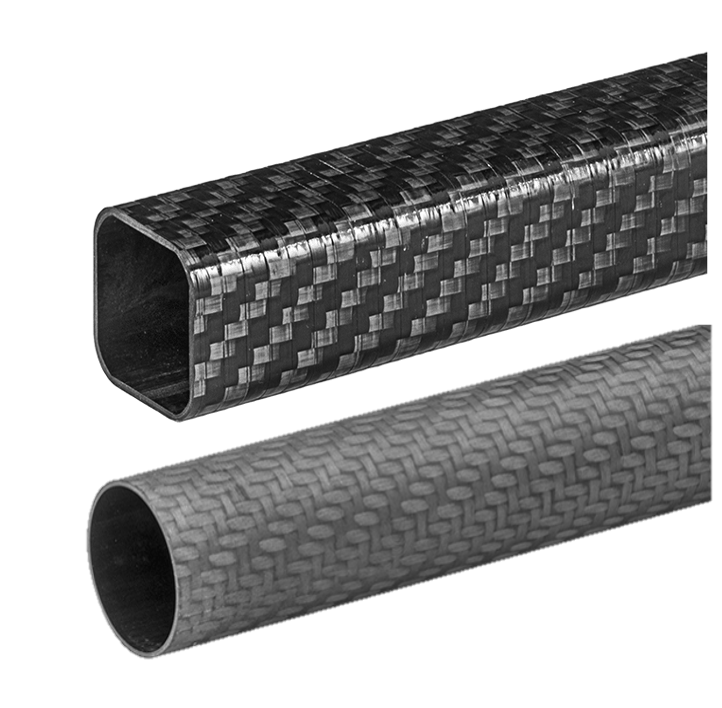
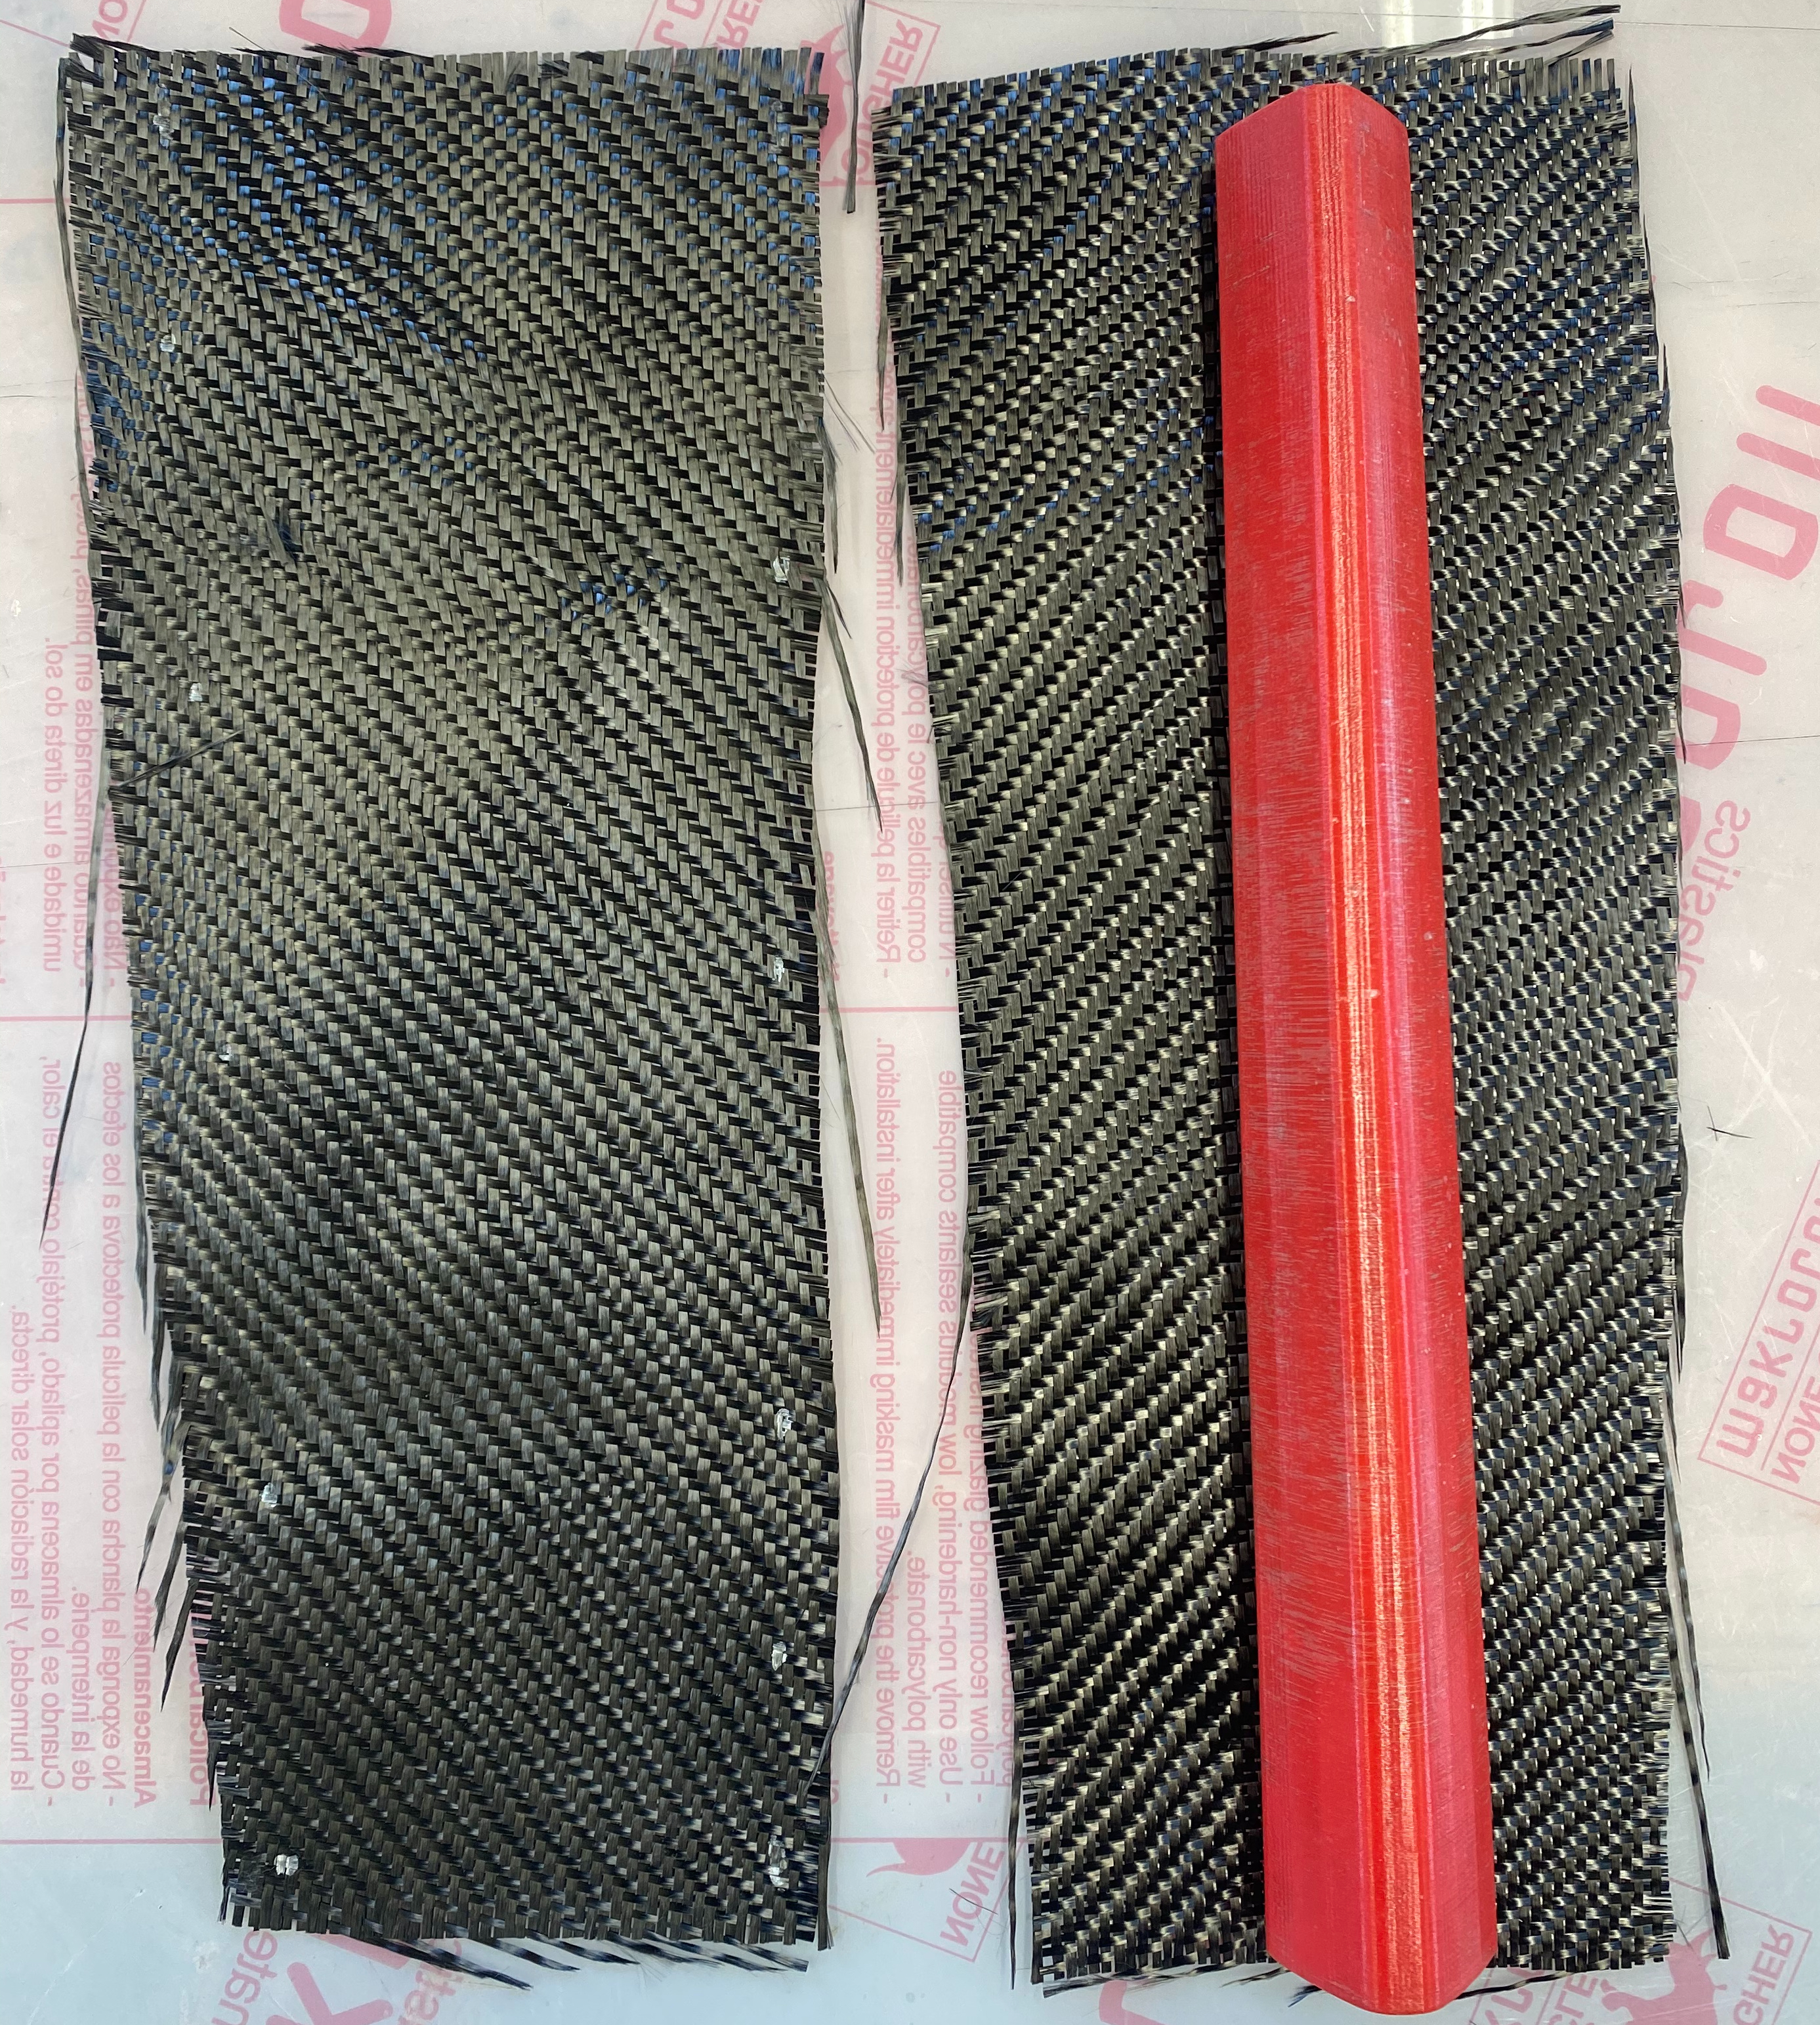
With this in mind, fatigue testing of the manufactured carbon fiber top tubes would be a realistic and informative approach to understanding more about CRFP tube behavior. However, performing static testing is an important first step before fatigue testing, both to confirm theoretical and simulated results, and to help fully characterize the shape’s behavior. The top tubes I manufacture and test in this experiment are fully anisotropic, as I included multiple layers of a 2×2 twill weave seen in the photo to the right.
Simulation of CRFP Tubes
Diving into the Theoretical
Models
I explored four unique tube geometries, two of which are based on top tubes from commercially-produced carbon fiber road bikes by Orbea and Ridley. The remaining two tubes are simple circular and square cross section lengths of CRFP material manufactured by McMaster Carr. Each tube is 12″ in length, and the bike-specific tubes taper to a narrower cross section.
The four unique tube shapes considered for this project
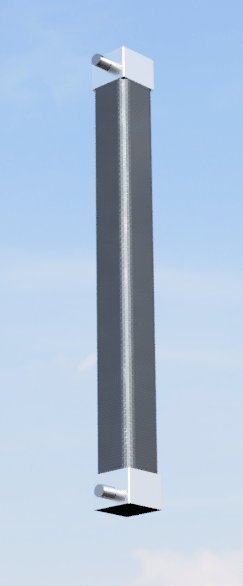
I modeled the cylindrical and square tube-and-lug assemblies with identical materials that are realistic to the compression testing described below. Specifically, the lug material is modeled with properties of 6061 Aluminum, the connecting pins are modeled with generic alloy steel, and the tubes are both modeled with twill CRFP materials according to the specifications listed on McMaster Carr’s website.
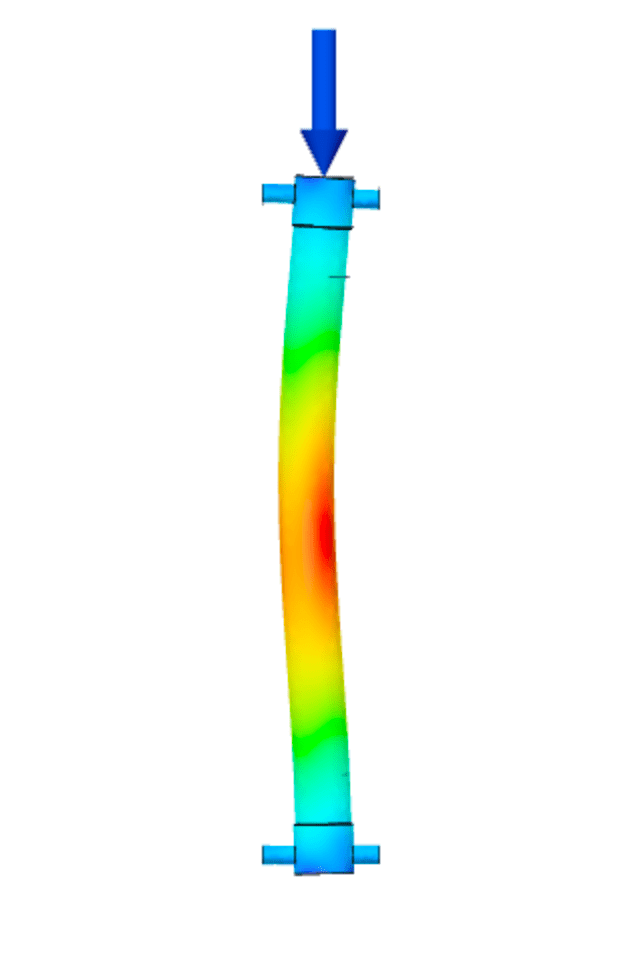
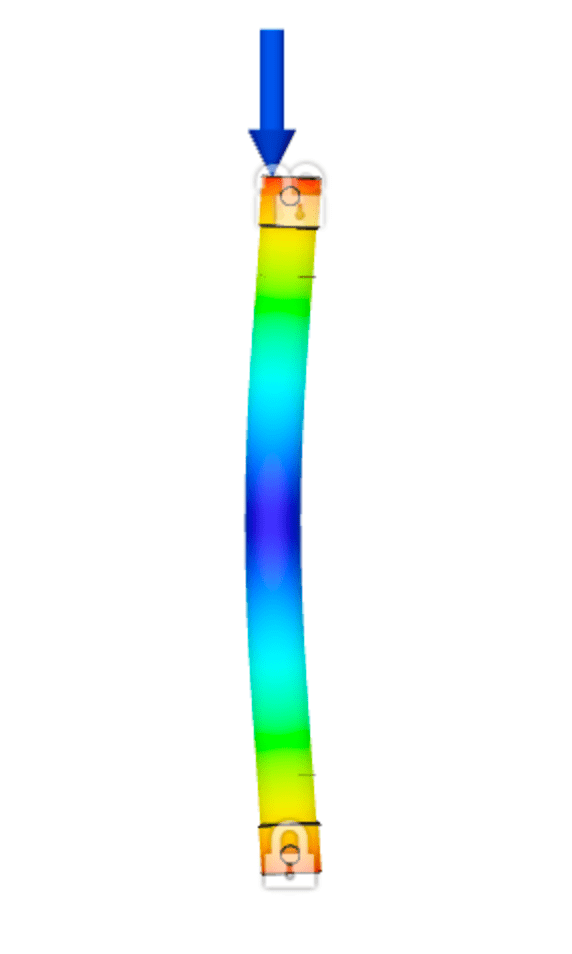
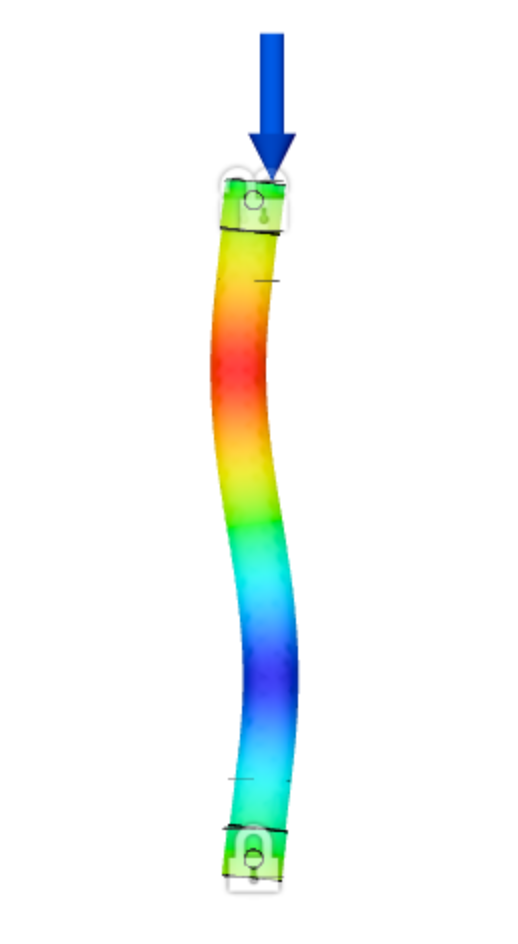
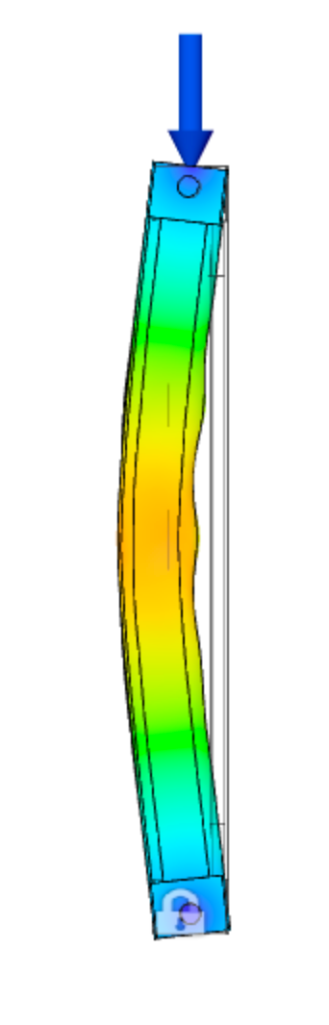
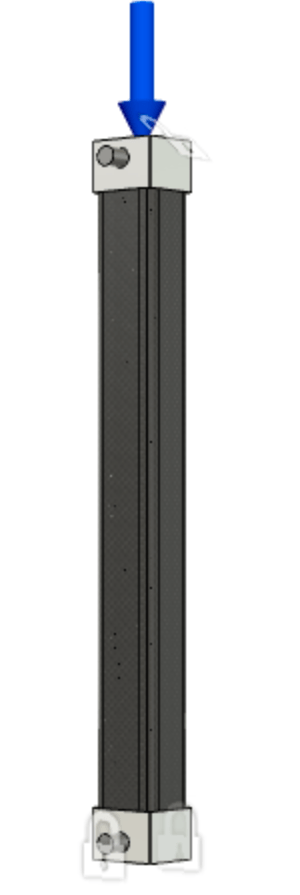
To prepare the models for simulation, I first constrained the lower pin to resist translation in X, Y, and Z. The upper pin was then constrained in the horizontal plane, X and Y, while full range of motion was allowed in the Z. This particular choice mirrors the action of the load cell head as it lowers along the Z-axis during compression. Finally, I added a 400 N force (seen in blue) along the top surface of the upper pin, mimicking the force of the load cell at the connection point.
With the exception of meshing the model, the last constraints to address are the contact sets. With five separate components acting together in each simulation, it is important to specify how each component surface interacts with the surfaces around it. This is particularly important in cases where surface interaction is ambiguous such as a clearance fit between components. The automatically generated contact sets in Fusion360 are ‘bonded’, and therefore the pin connections in this case actually act as a fixed connection with respect to the aluminum lugs.
These constraints are applied to both cylindrical and square tube assemblies. Check out the part drawings for the tubes and lugs below!
Simulation Results
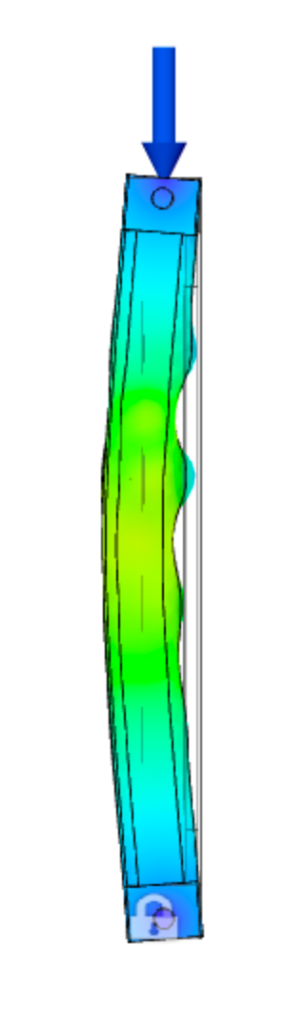
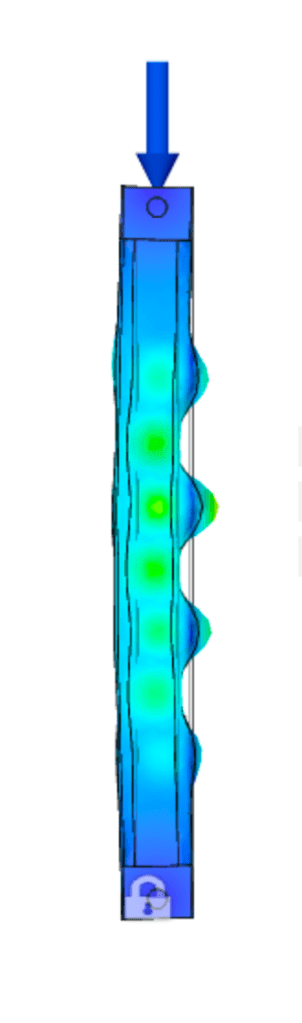
I performed buckling testing on both the cylindrical tube and square tube to compare approximate buckling loads between the two geometries, and to understand the most common deformation patterns. I specifically chose to visualize the first three buckling modes, and completed these simulations in Autodesk Fusion360.
| Load (N) | Buckling Mode 1 | Buckling Mode 2 | Buckling Mode 3 | Number of Tet Elements | |||||||||
|---|---|---|---|---|---|---|---|---|---|---|---|---|---|
| Circular Tube Assembly | 400 | 565× | 797× | 1351× | 41,740 | ||||||||
| Square Tube Assembly | 400 | 1372× | 1499× | 1521× | 35,628 |
The results of the first three buckling modes showed that at the compressive load of 400 N, the load multipliers in order to achieve material buckling are extremely high. The lowest data point suggests that it would take a compressive force over 500× larger (~220,000 N) to cause true buckling in the tube. However, these results are not meant for quantitative decision making, and rather to understand relative strength of each tube given identical material properties and assembly setup. Given these results, the square cross section appears to provide significantly more strength against buckling. Read on to see if this is confirmed in the physical testing of both tubes at sub-buckling loads.
Takeaways
Performing basic buckling simulations in Autodesk Fusion 360 is fairly simple, and after some thought about the end conditions in the physical test setup, it was possible to establish similar conditions to the simulation. However, for future simulations it would be useful to establish end conditions using a specific ‘Pin’ feature which would truly treat the top and bottom connections as pinned rather than bonded. In addition, performing basic static tests on complex models is a recommended step in characterizing the behavior of a unique geometry. Complete this step particularly if the model configuration prevents easy intuition of the deformed shape.
Drop down to the Testing Section to see how these two compared during experimental compression testing!
Manufacturing CRFP Tubes
The Wet Lay-up Process
Carbon Fiber Wet Lay-up
The wet lay-up composite manufacturing process consists of the careful combination of the matrix material and the carbon fiber fabric. Together, the combined composite generally exhibits higher compressive and tensile strength than either material individually. The ratio of fiber volume to total composite volume is referred to as the volume fraction or fiber fraction. This value dictates the strength and therefore success of the final product, as a careful balance must be maintained to prevent insufficient coverage of the fabric and excessive brittleness in the cured component when too much matrix material is applied. Pre-impregnated fiber material is produced with the optimal volume fraction, but is significantly more costly and requires a more involved curing process. Overall, the wet lay-up process is complex, and involves many supporting supplies, but is certainly feasible for all levels of undergraduate and graduate education.
Although techniques such as split-molding, internal bladder, and filament winding are all feasible methods for creating tubes with non-constant cross sections, I chose the roll-wrap wet lay-up method for my geometries. This was ultimately the simplest manufacturing method which involved the least additional machining and did not require pre-preg carbon fiber material. Choosing this manufacturing method allowed me to focus on the fundamentals of composite component development, without spending the entire semester on tooling and budgeting for costly materials. Without any prior experience in composites manufacturing, I chose to focus on producing only one of the original tube geometries. The procedure file linked below also includes information on creating coupon cards as preliminary testing samples for the composite material.
Preparing Materials
The key materials needed for this process and their sources include:
| Product Used | Spec.s | Sourced From | |
|---|---|---|---|
| Carbon Fiber Fabric: | 2×2 Twill Standard Modulus Fabric | 3k Tow | Composite Envisions |
| Matrix: | Thin Epoxy Resin (Two Parts) | Model #1161 | Composite Envisions |
| Component Mold: | ABS Plastic | N/A | Custom Printed |
| Release Agent: | PVA Release Film, 1 Quart | 13-A | Fibreglast |
| Breather Cloth: | Medium Weight Polyester Batting – 60″ | 2 yards | Total Boat |
| Peel Ply: | AirTech Bleeder Lease B Coated Peel Ply – 60″ | Model #511 | Composite Envisions |
| Vacuum Bag: | AirTech Stretchlon 200 Vacuum Bagging Film | Model #1223 | Composite Envisions |
| Respirator: | P100 Filter, NIOSH #TC-84A-7529 | Part #54445T156 | McMaster Carr |
Other important accessories include:
- Several pairs of nitrile gloves
- Sharp cutting tool or round blade
- Scale with precision up to at least ten-thousandths
- Set of calipers or measuring tape
- Duct Tape
- Sharpie
- Cups and mixing sticks
- Work surface (ex. workbench covered in a layer of cardboard)
Preparing the Mold
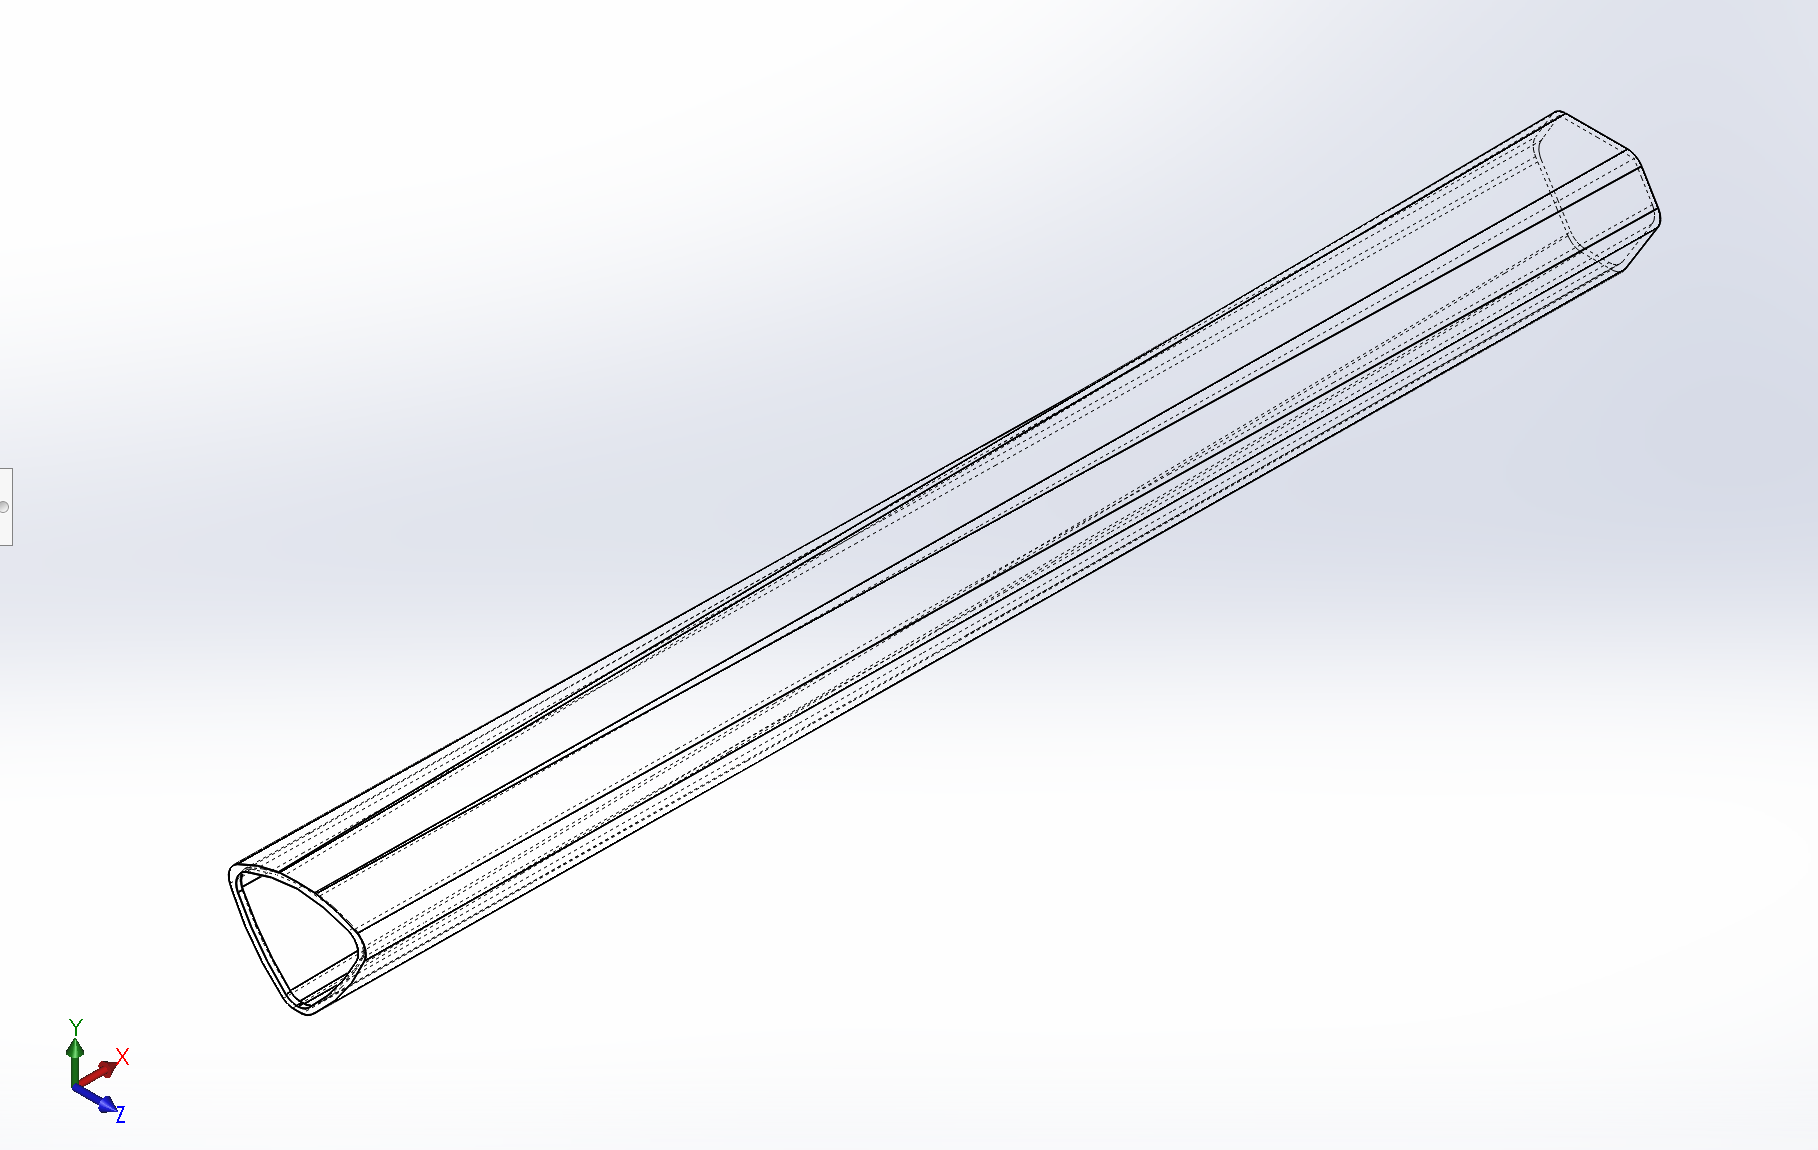
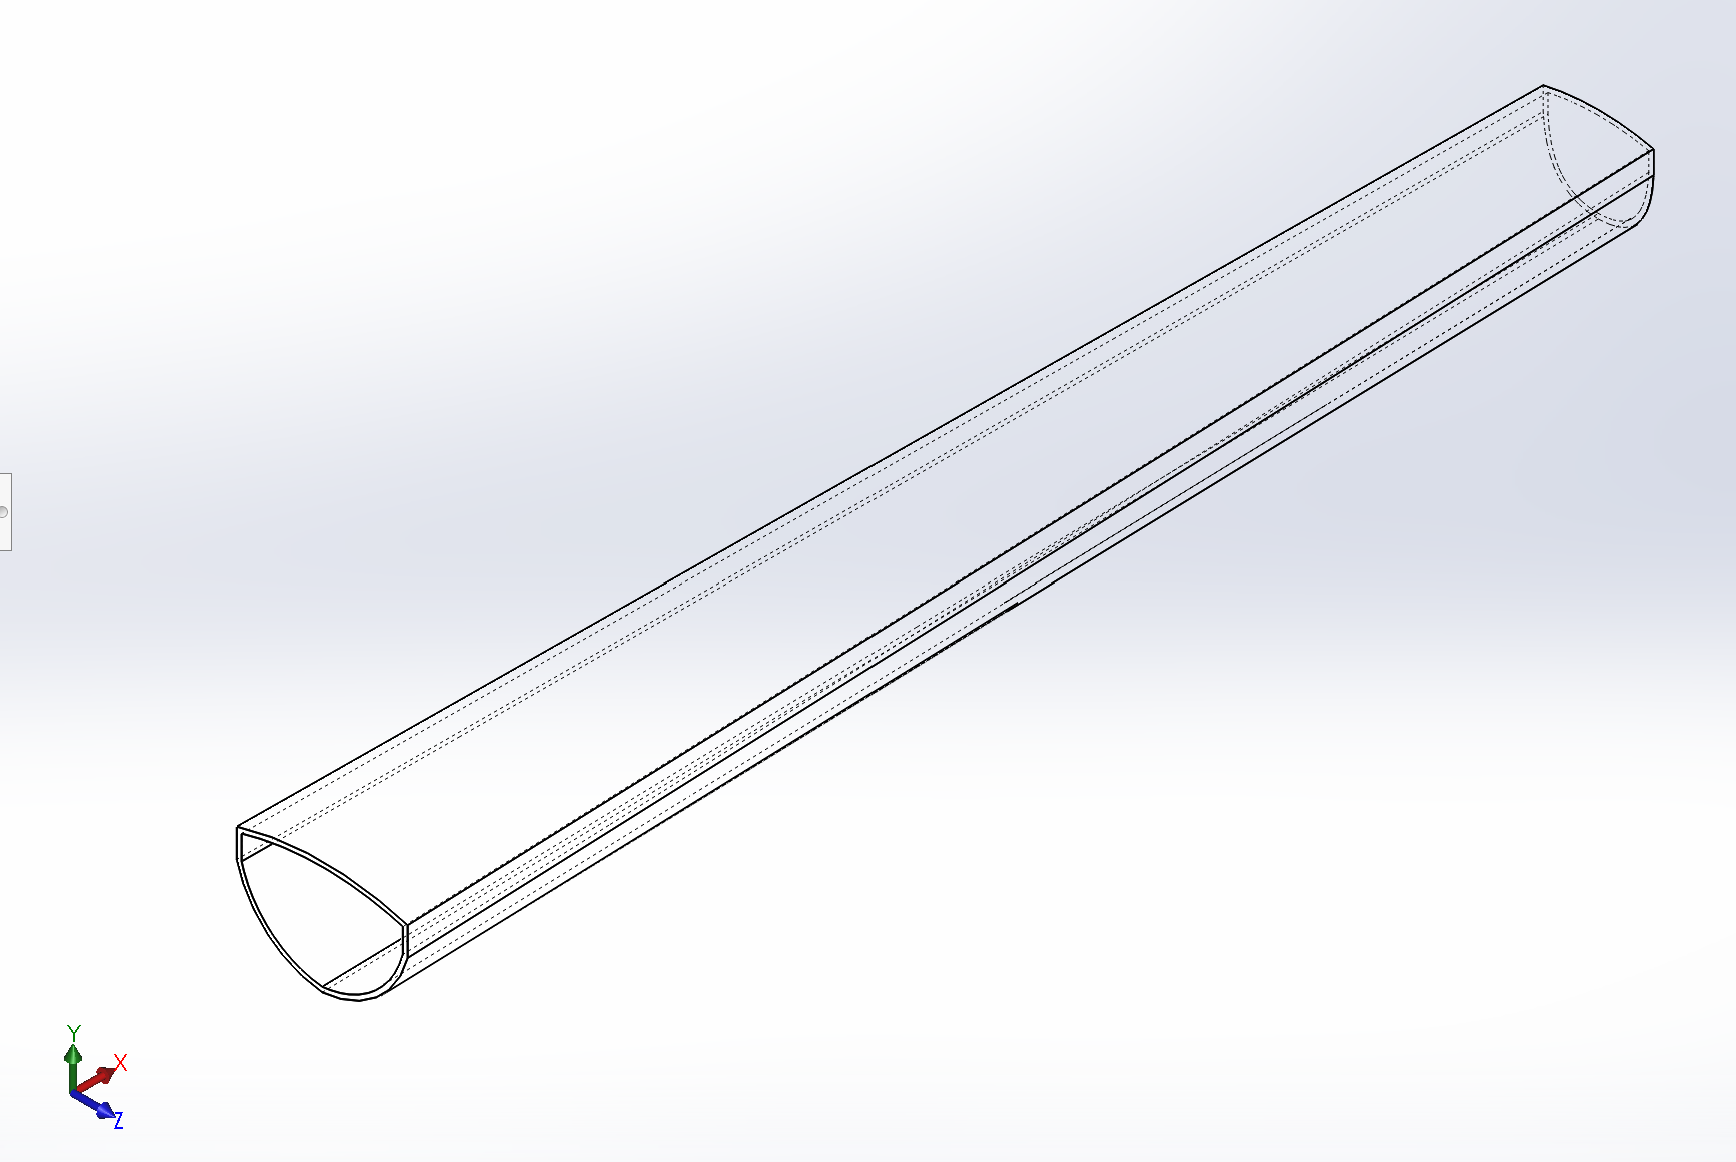
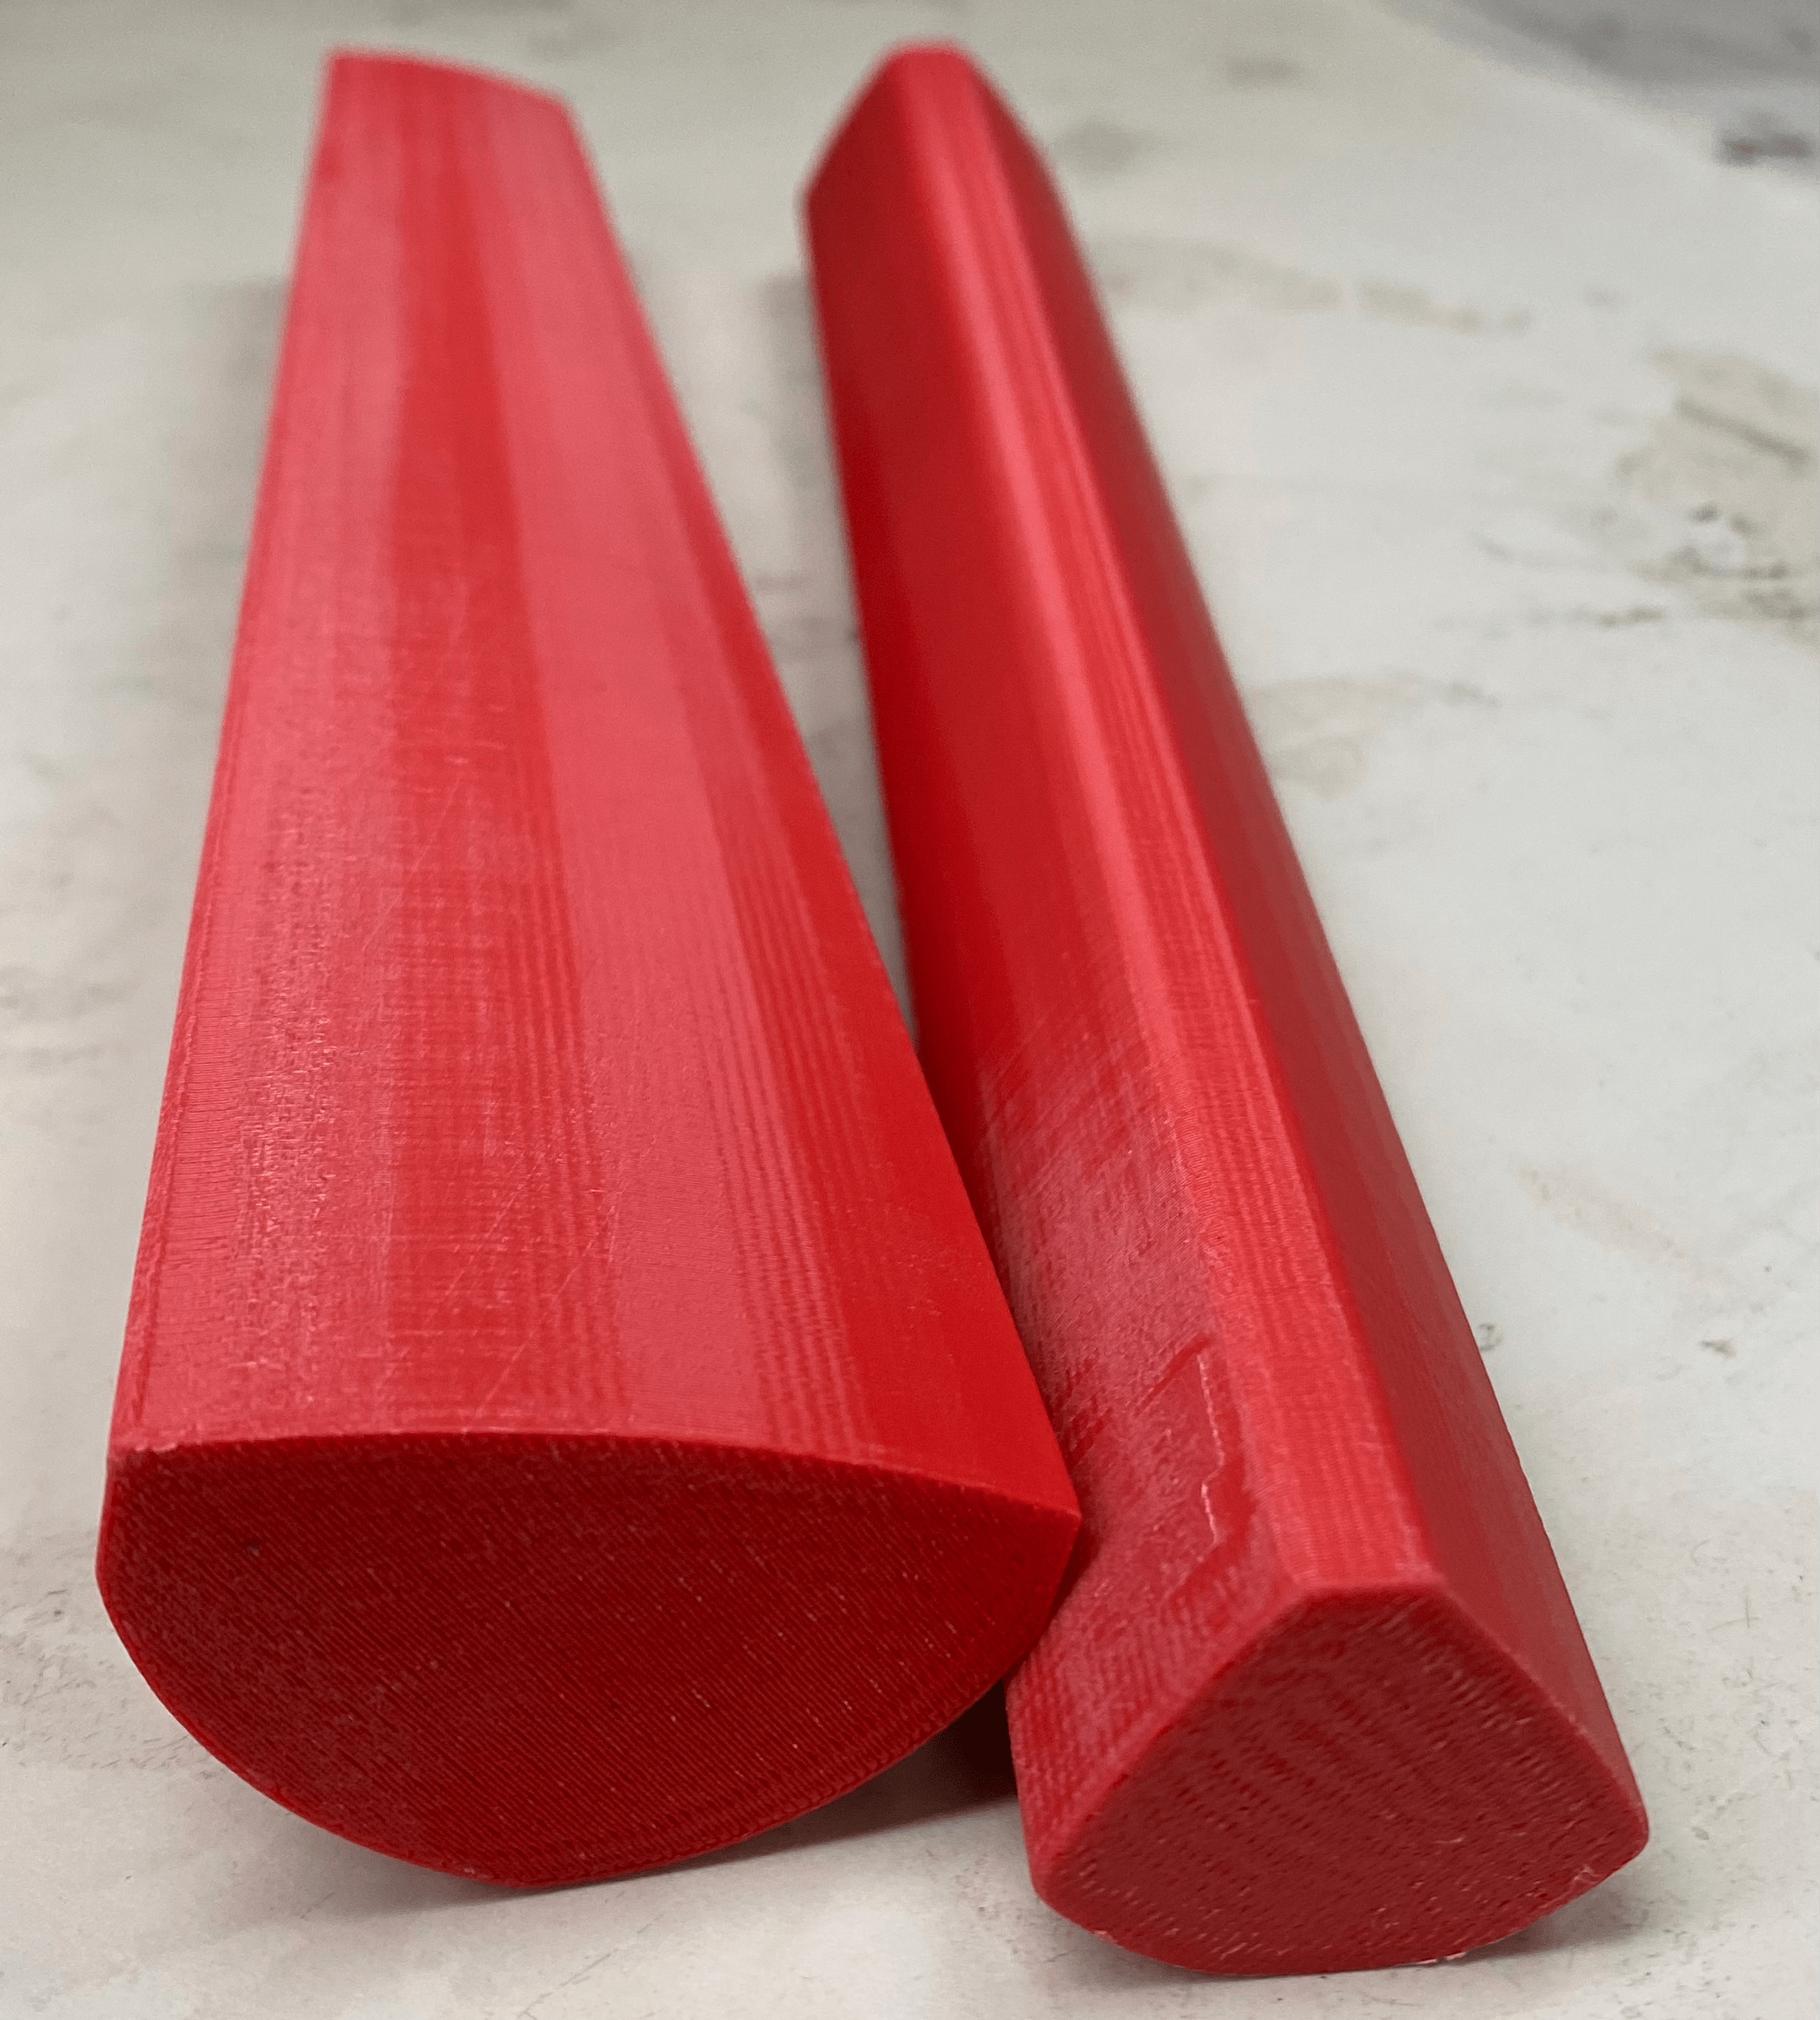
This roll-wrap manufacturing method requires that a solid mold of the desired geometry over which the carbon fiber sheets will harden and take the mold’s shape. On the right is an image of the cross section of the manufactured tube, whose dimensions are of a 2014 Ridley FenixSL carbon fiber top tube, size 52cm. Using this file, I created the mold part in SolidWorks and printed the final mold design in red ABS plastic on a high resolution FDM 3D printer.
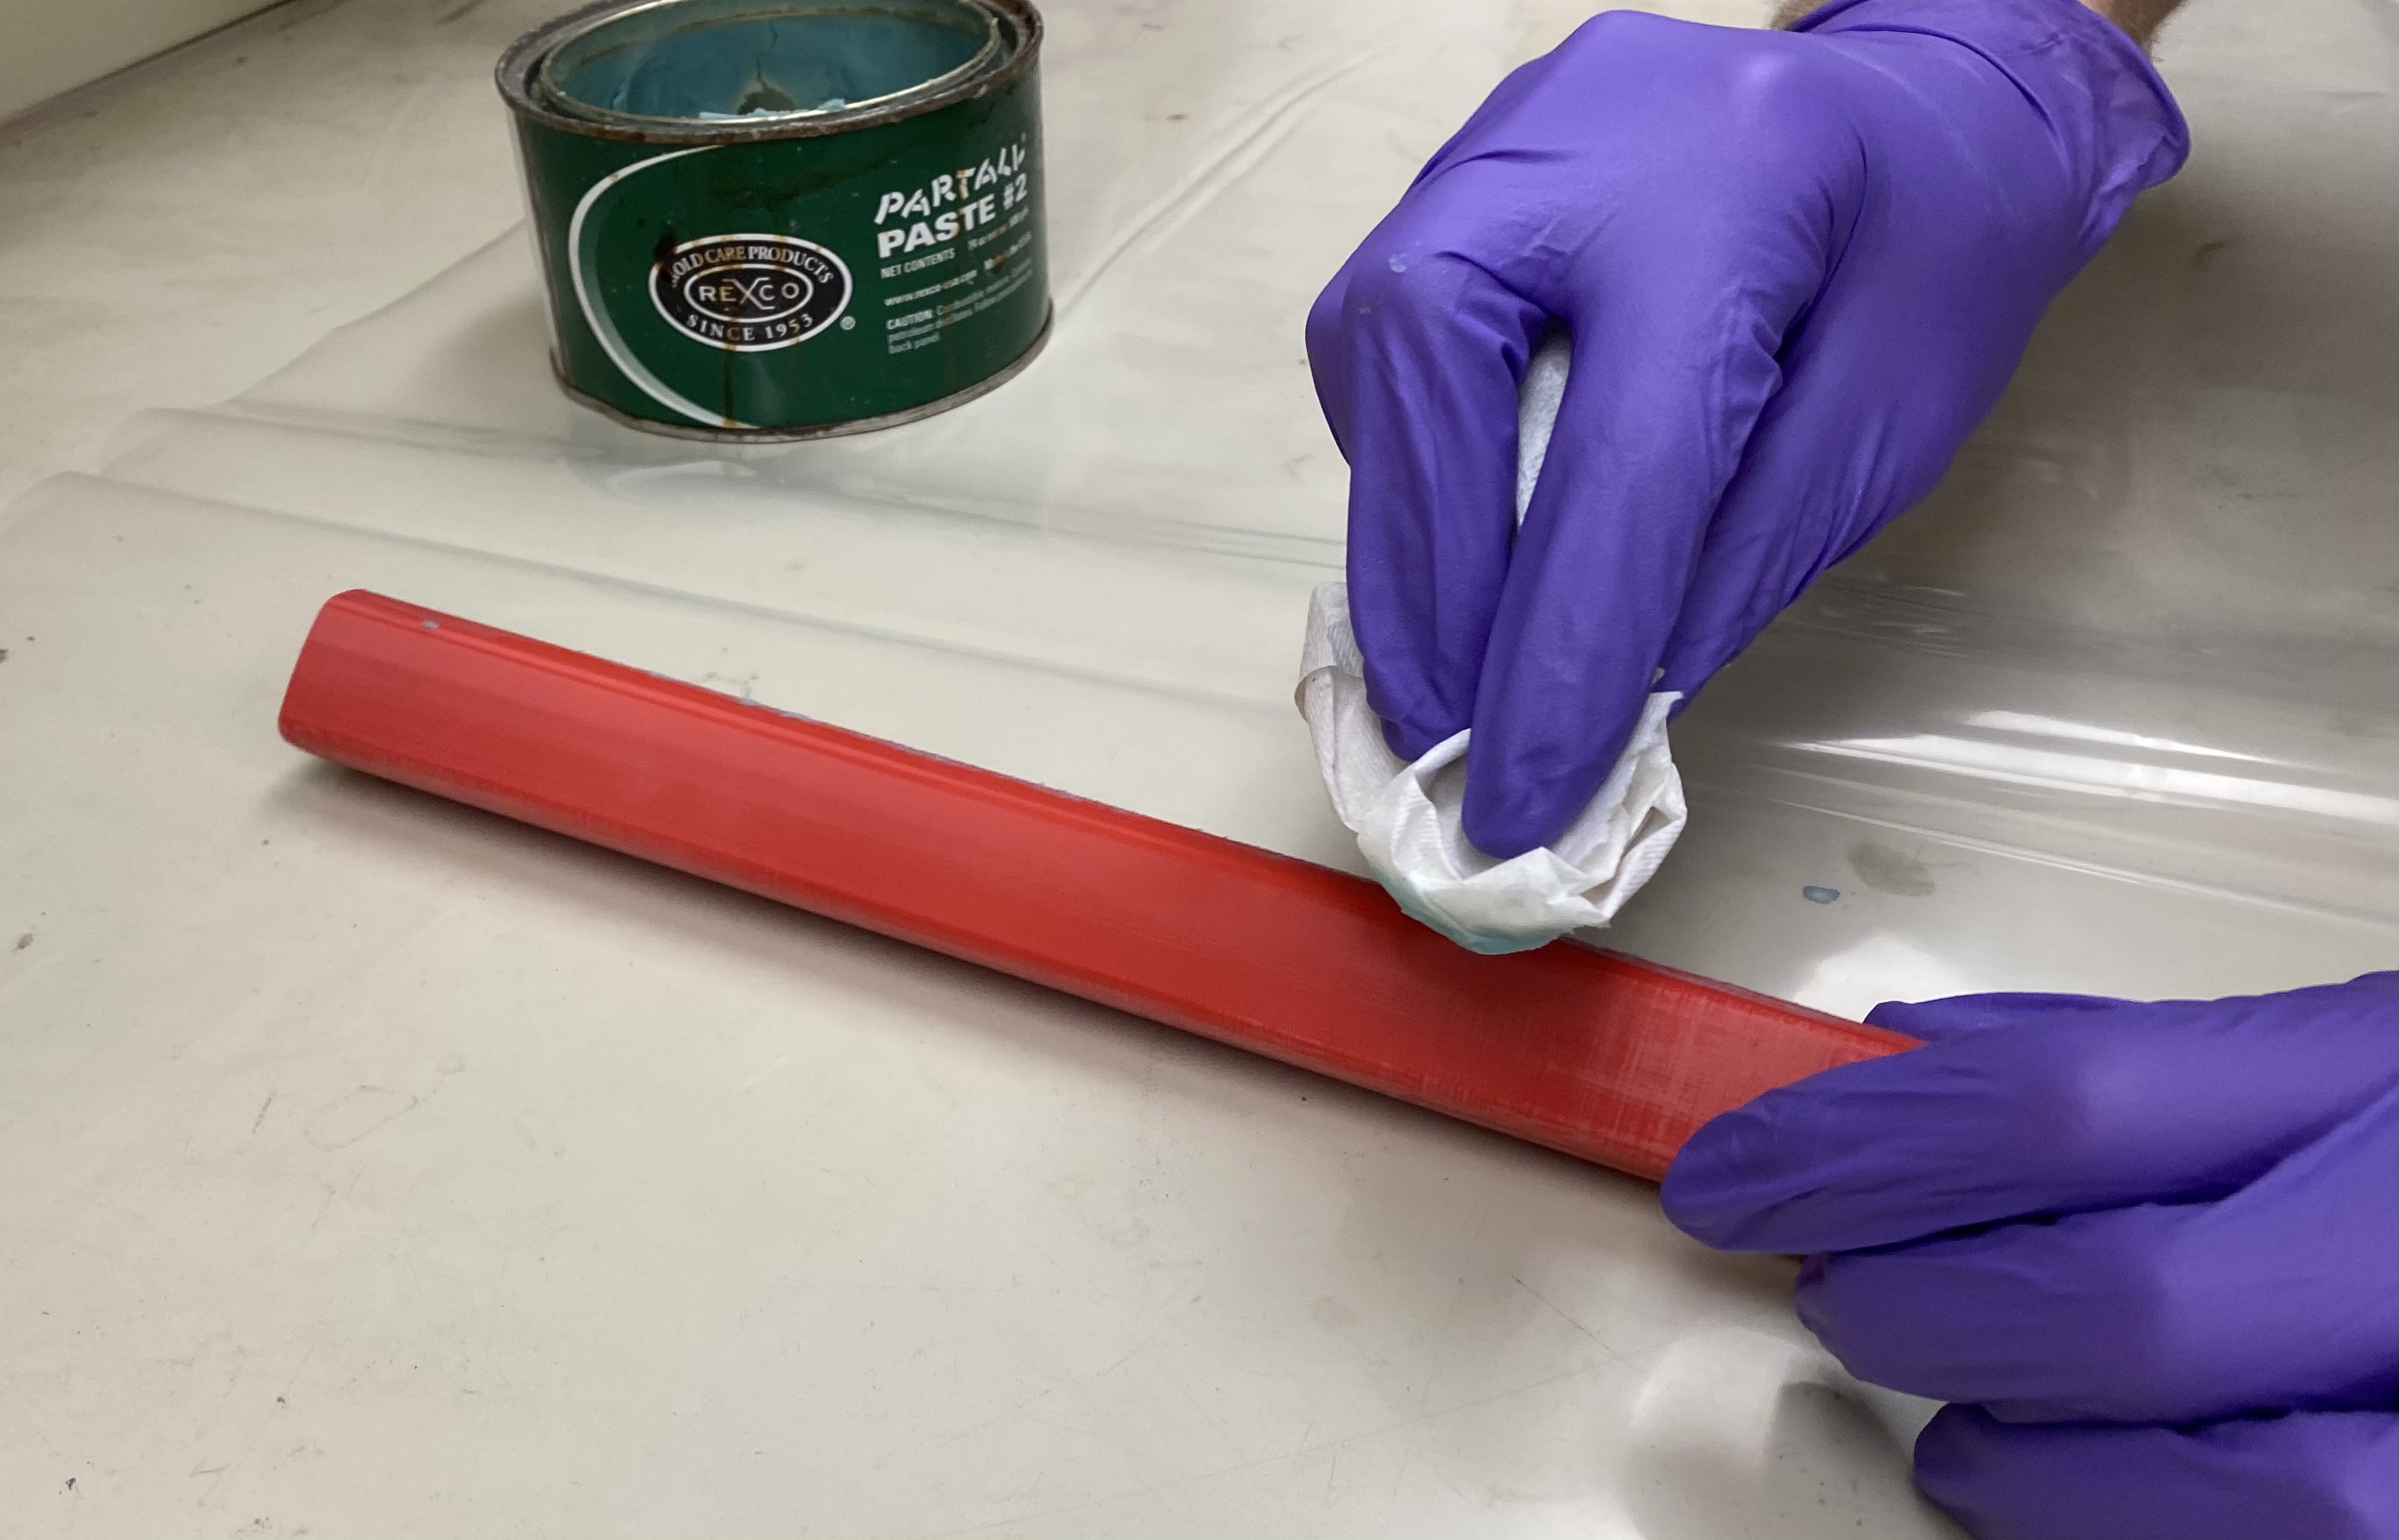
The next step is to prepare the surface of the mold for the lay-up by sanding imperfections then placing the ABS mold in an hour long acetone vapor bath to smooth out the thermoplastics’s surface. See the corresponding image on the right, which demonstrates the application of wax and liquid polyvinyl alcohol (PVA) which acts as a water-soluble mold-release agent.
Preparing the Carbon Fiber Cloth
There are several ways to develop a ply pattern for the fabric using the CAD model of the desired finished part. Using sheet metal tools or ‘unfolding’ commands in the modeling software can help to reveal a 2D pattern from a 3D object. For an instructional video on how to complete this task in SolidWorks, look here. I followed this process to develop a pattern for the ‘diamond’ shape cross section of the Ridley Fenix inspired top tube. The pattern is then exactly adapted to produce the cross section shown in this section when wrapped around the 3D printed mold. In more complex applications, this process is called developing a ‘ply schedule’, which is a spreadsheet detailing the shape of each ply, as well as its location and orientation relative to the rest of the component. Developing a sophisticated ply schedule often requires the use of software tools such as HyperSizer Pro or the SolidWorks add-on, Laminate Tools.
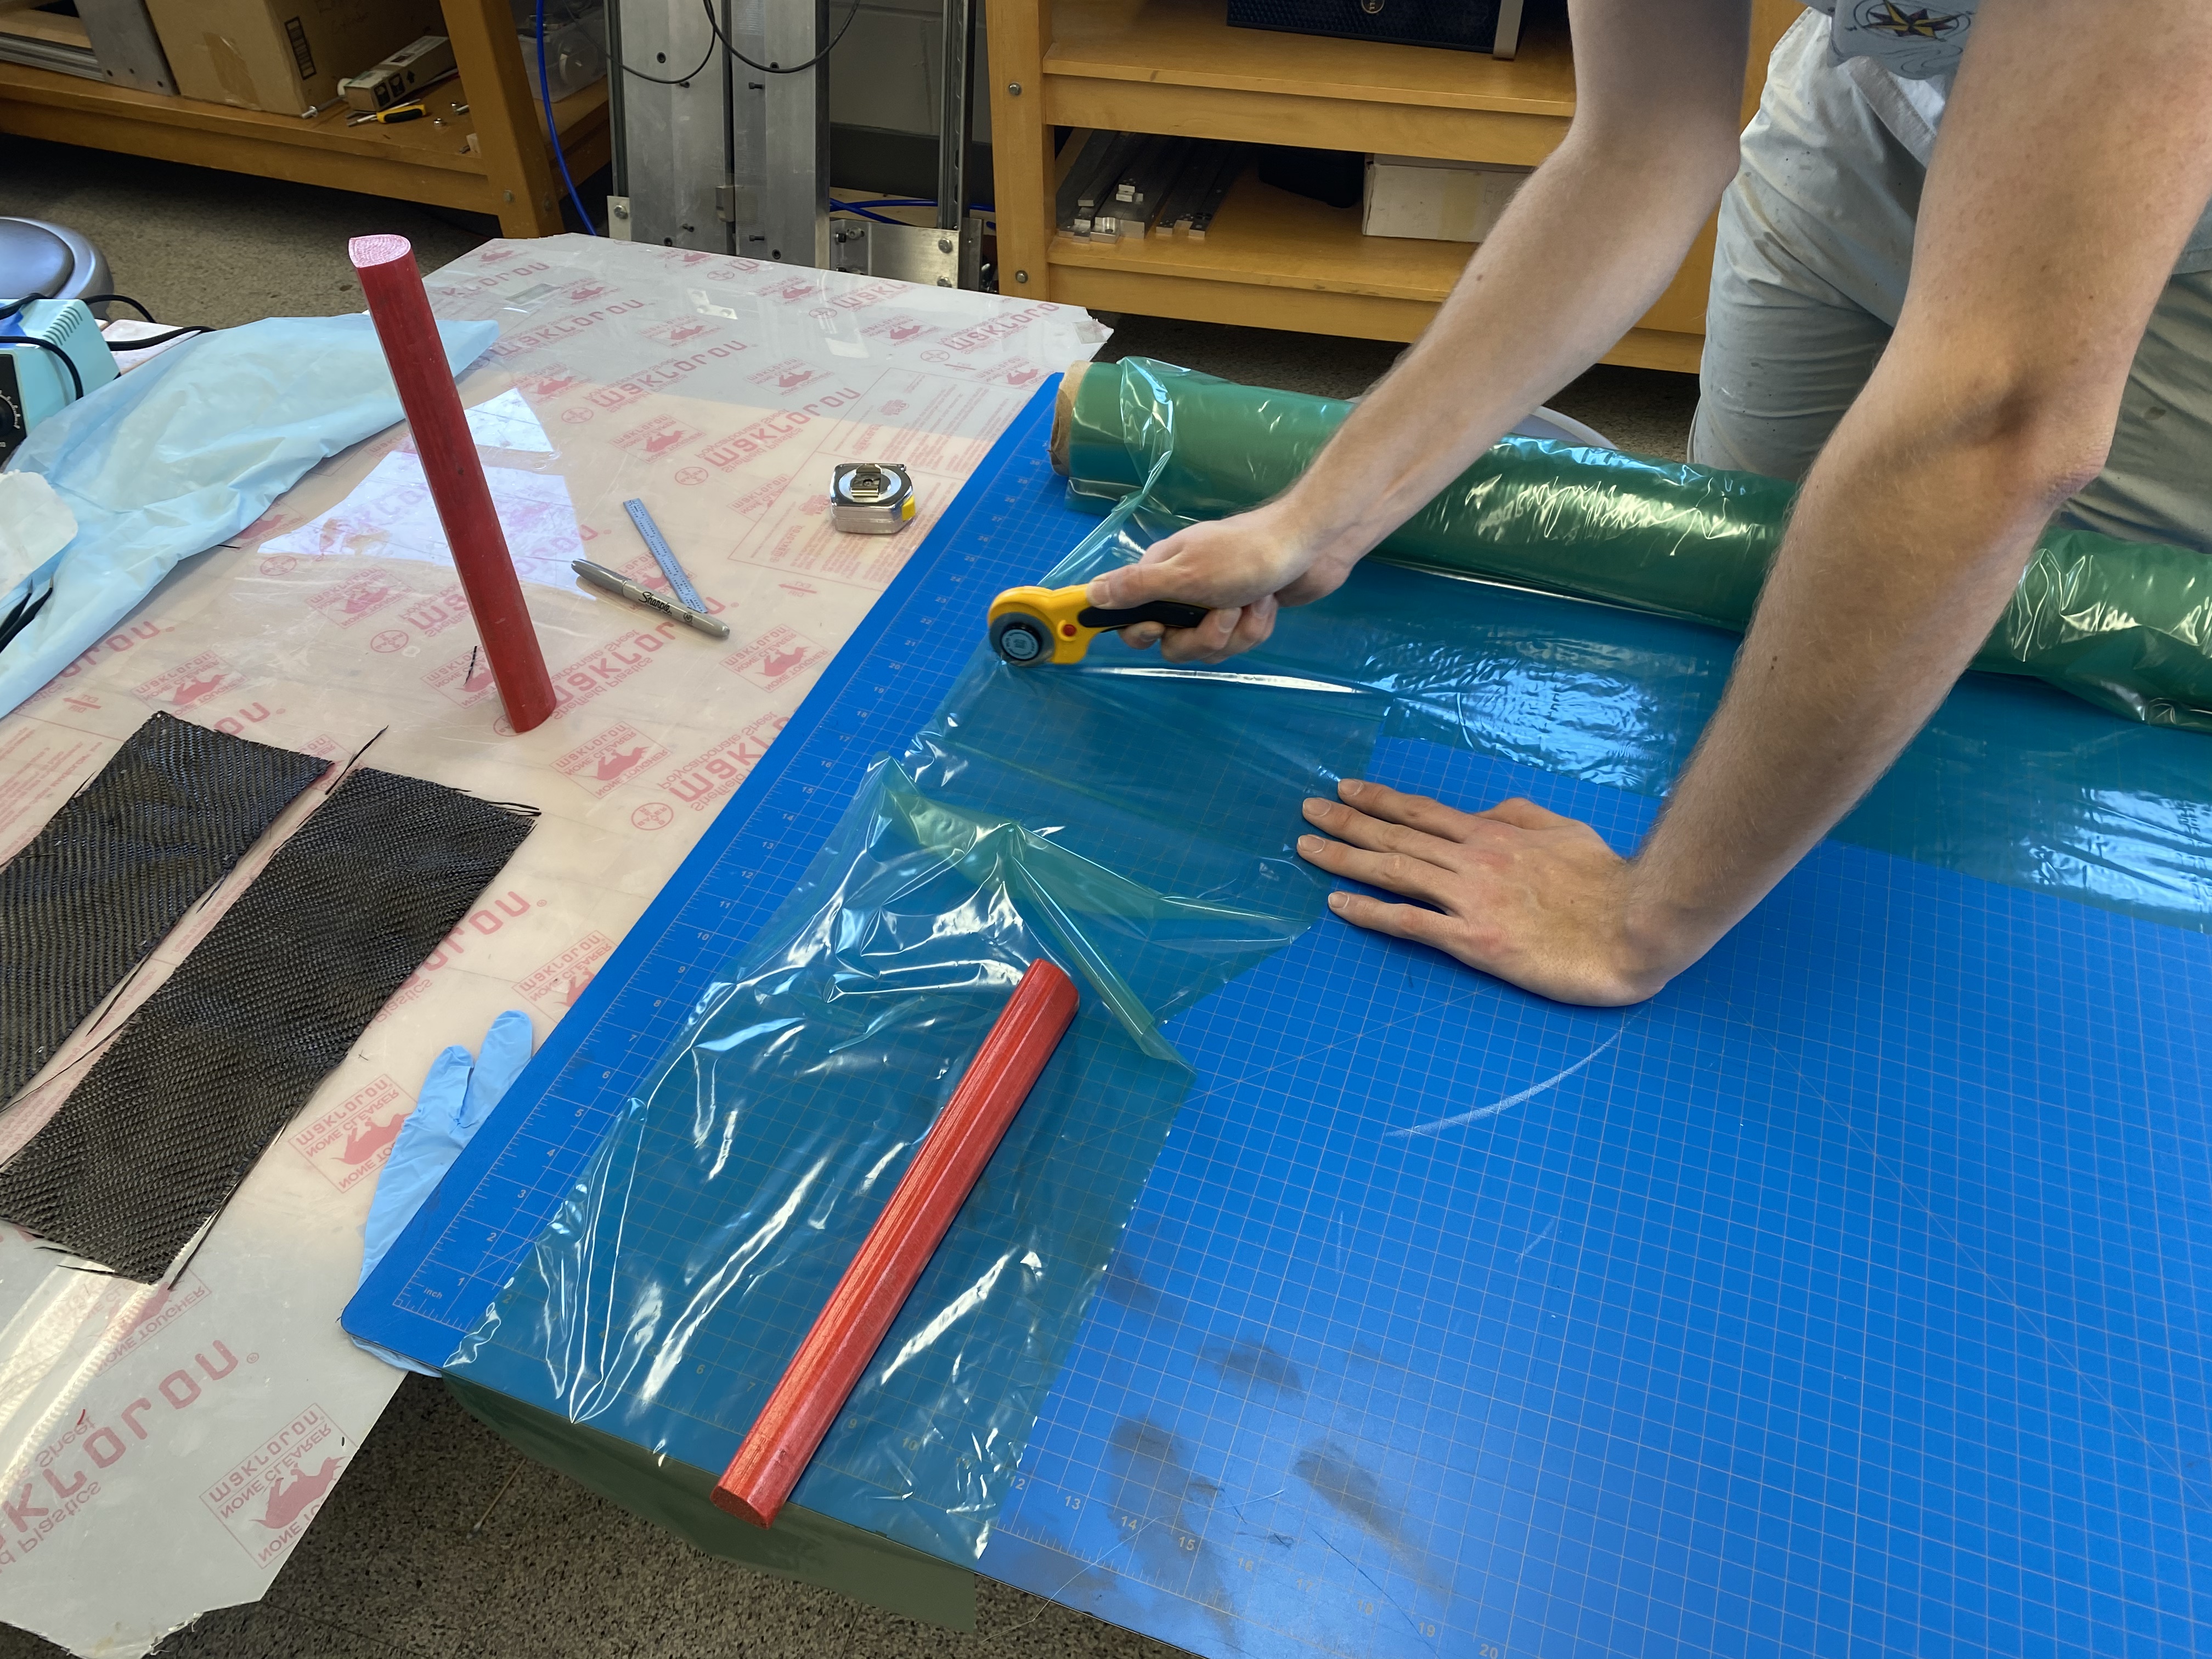
The carbon fiber cloth is the main constituent of a carbon-fiber-reinforced-polymer part, so it is very important to ensure the fabric is cut both accurately and precisely. The weave of the raw fabric can easily become misaligned, and is susceptible to fraying at cut edges. As a result, the fabric should be handled with care and moved as little as possible. Use the sharpie and measuring tool to mark out the shape of the ply, adding about 1″ additional material on each edge. Adding extra material helps to prevent fraying of the fibers in the center of the ply. Carefully cut the material to the specified shape, being sure to not the orientation and angle of the weave relative to the desired position of each ply in the final component. A photo of the cut plys for the 3D printed mold is shown on the right.
Performing the Lay-up
It is important to become familiar with each of the individual materials used in a composite manufacturing procedure, as they are many but each has a specific and important role to play. I created the diagram below to demonstrate how each of these pieces are placed during the curing process, and indicate the order of operations for the manufacturing process.
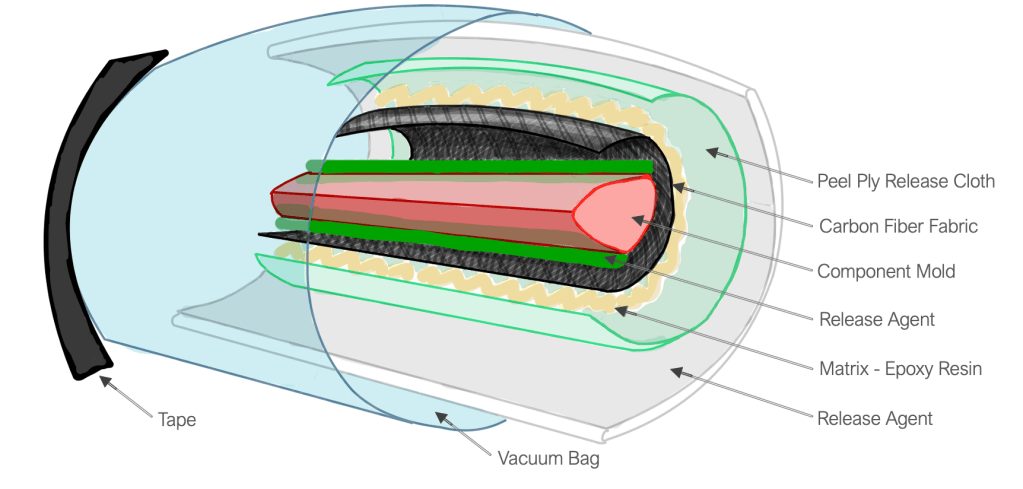
Explore the PDF of my procedure file below!
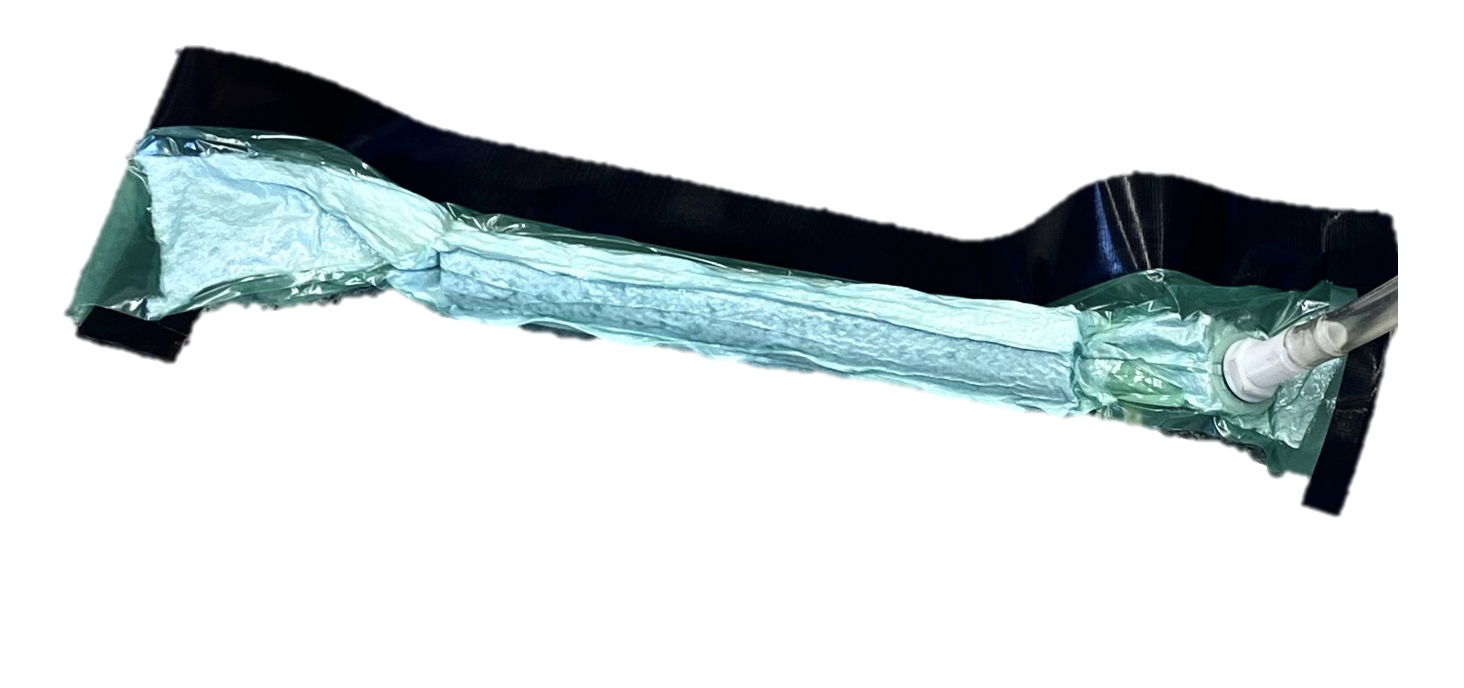
The timing of processes a wet lay-up procedure is crucial, so it is important to keep an eye on the clock, as well as have all materials well organized and all plys (carbon fiber, peel ply, and breather ply) measured and cut before mixing the two-part epoxy. The primary time constraint stems from the limited pot life of the epoxy resin, which is about 25 minutes for the product used in this project. Acting quickly, accurately, and carefully is key.
The epoxy material will list a generic volume ratio of the mass of the carbon fiber plys to the required mass of both parts of epoxy. The ratio used for this project was ~1.6, however this number can be difficult to track if additional matrix material must be mixed during the manufacturing process. Additional reading on a more detailed process for this calculation can be found here.
Takeaways
- Plan plan plan!
- This process takes practice, try to complete some mock lay-ups before developing your final parts.
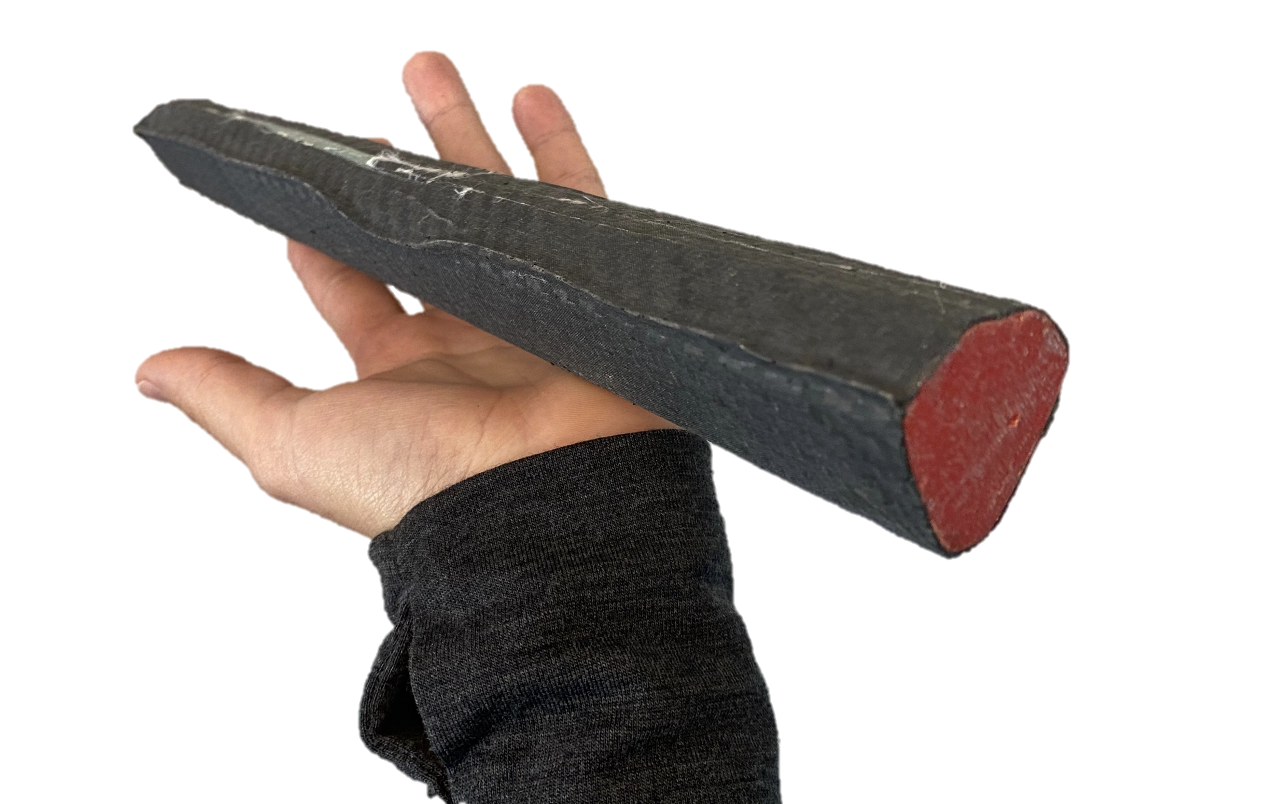
- Try to make sure the ply is very firmly and tightly wrapped around the mold before placing into the vacuum bag, this will help to prevent wrinkling which occurred in the ‘diamond’ shape cross section component (see images of the cured product on the right).

Testing CFRP Tubes in Compression
Data Acquisition & Analysis
Although four unique tube shapes were originally considered for the project, the quality challenges during manufacturing caused me to focus on the two pre-manufactured simple cross section tubes produced by McMaster Carr. I chose to complete compression tests at mild loading to gather data on the resulting strain and deflection in both tubes at the maximum selected load. The following information can be categorized as intermediate-level skills involving basic force analysis, CNC machining, basic circuitry and data acquisition, and simple data analysis.
1. Basic force analysis
Since this project is fundamentally tied to the strength and performance of high end carbon fiber road bikes, the testing procedure should be based upon a realistic scenario which a road bike frame would experience. Although testing at the extremes of load or deflection can provide important and useful data for design, testing relatively benign compressive loads will reveal the relative strength of the two tubes under realistic conditions. This will inform the shape of the curve in the elastic phase of the stress-strain plot, and help to characterize the behavior of the elusive and complex CFRP.
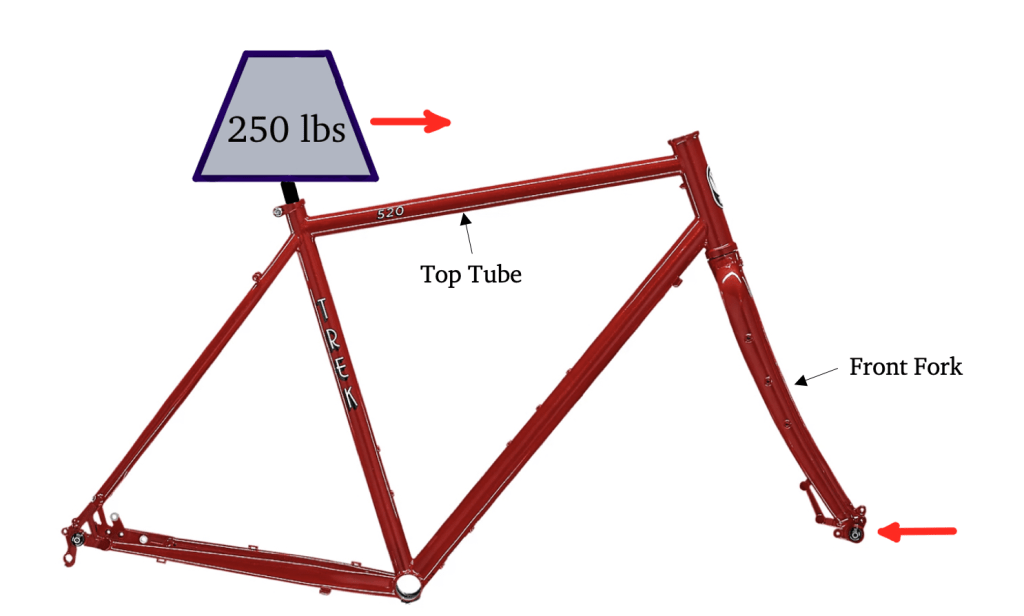
On the right, I developed a basic diagram indicating the main forces acting on a road bike frame of negligible weight in the case that a 250 lb (113 kg) rider decelerates from 20 mph (8.9 m/s) to a stop in 5 seconds. Gravity is ignored. A rider weight of 250 lb is chosen since it is a common maximum rider weight listed for carbon fiber road bike frames. In this scenario it is assumed that the rider brakes with only the front brake (not a great idea!) and that the bike is equipped with disc brakes rotating around the very tip of the front fork. The red arrow indicates a ‘braking force’ as a result of the deceleration.
Given that the rider (113 kg) decelerates at a pace of 8.9 m/s in 5 seconds, the resulting force of the rider’s body in the horizontal plane is 201.1 kgm/s^2 or 201.1 N. Given that each joint in the bike is has unique boundary conditions, let’s assume that 65% of this horizontal load is sustained by the top tube, the component of interest. The resulting force is ~130 N of compressive force being delivered through the top tube to the stationary head tube. After applying a factor of safety of 3, the total compressive load comes out just under 400 N.
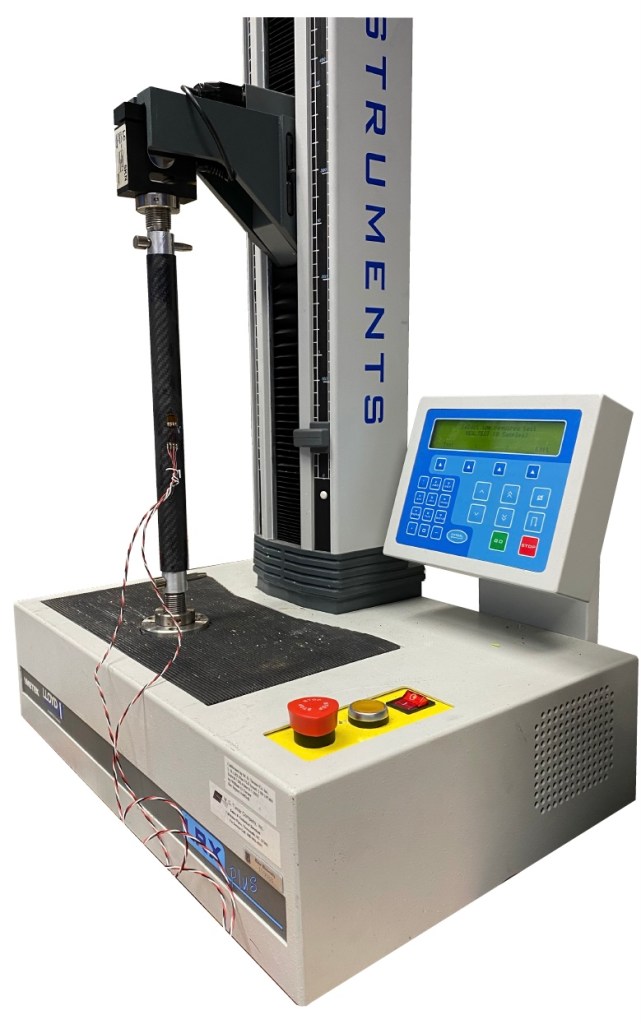
To test a compressive load of 400N, I chose to use a Lloyd Instruments Ametek LRX Plus Testing Machine with 5kN load cell. I recognized the potential pitfall of using a load cell with a significantly larger range than I planned to use, and decided to include a 1000N compressive test as well (FS ~7.6) for comparison and to develop a more robust stress-strain curve.
2. Designing and machining test fixtures
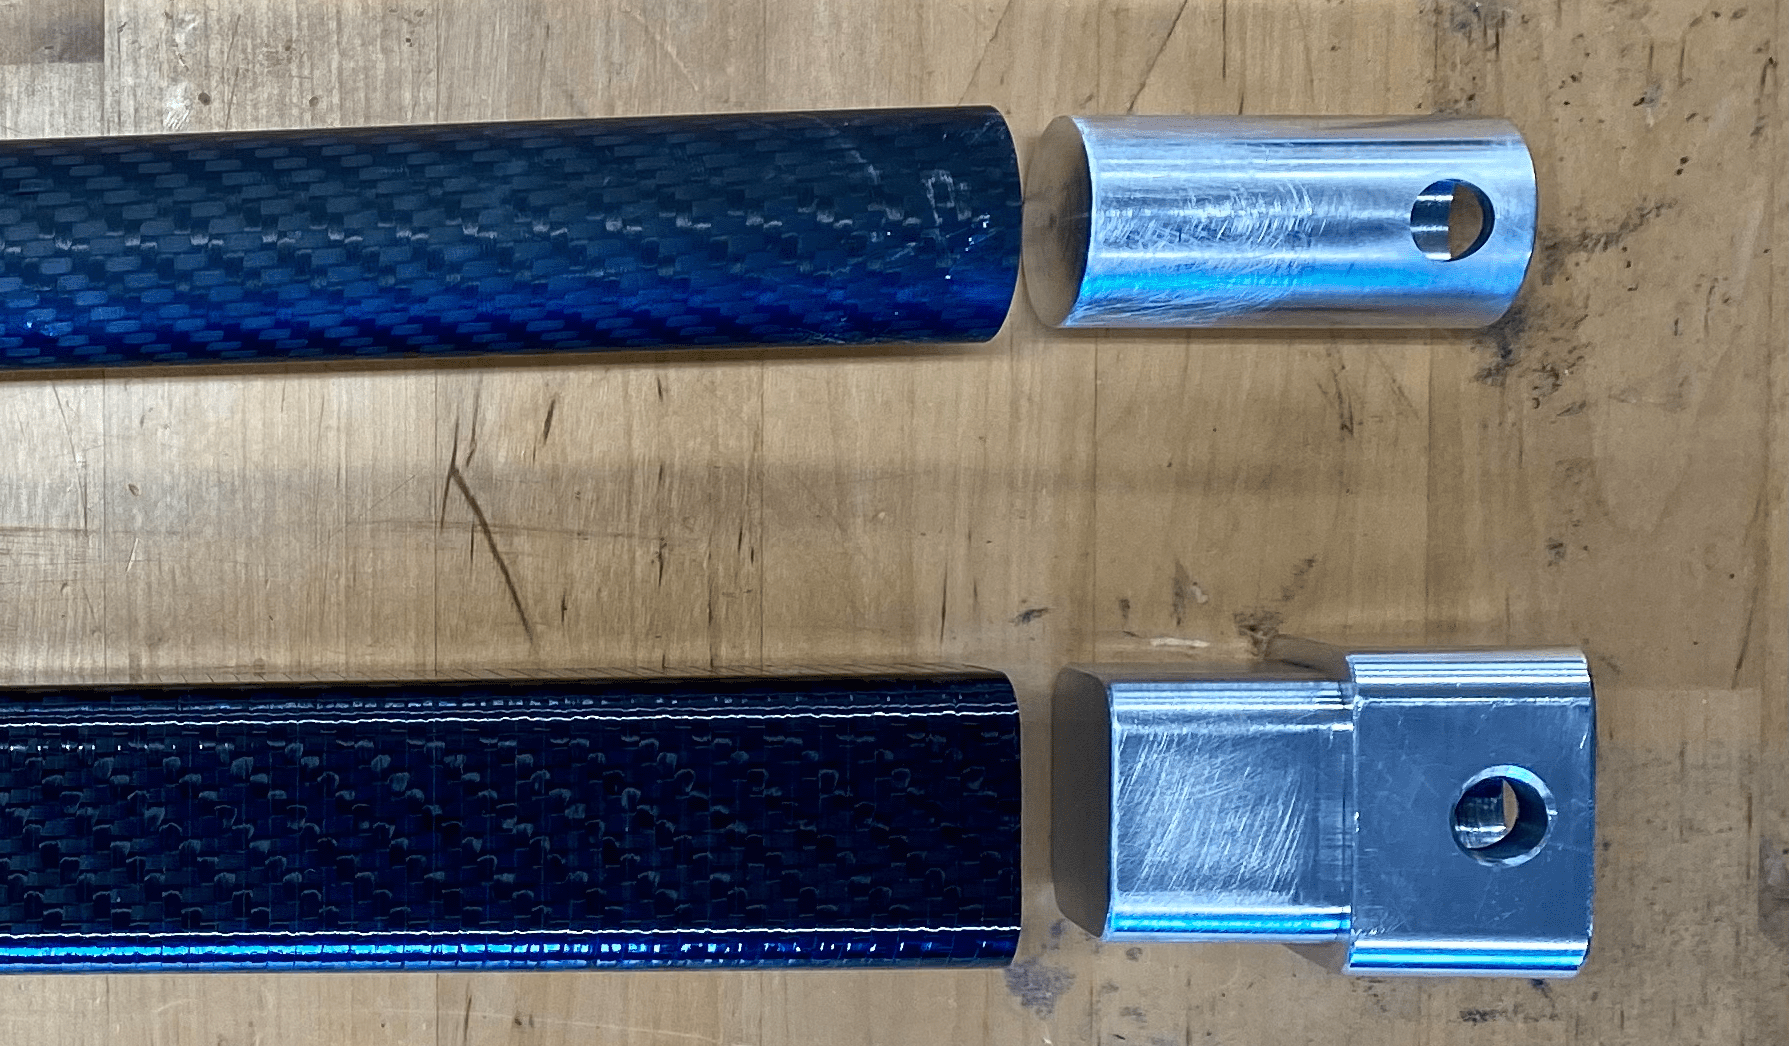
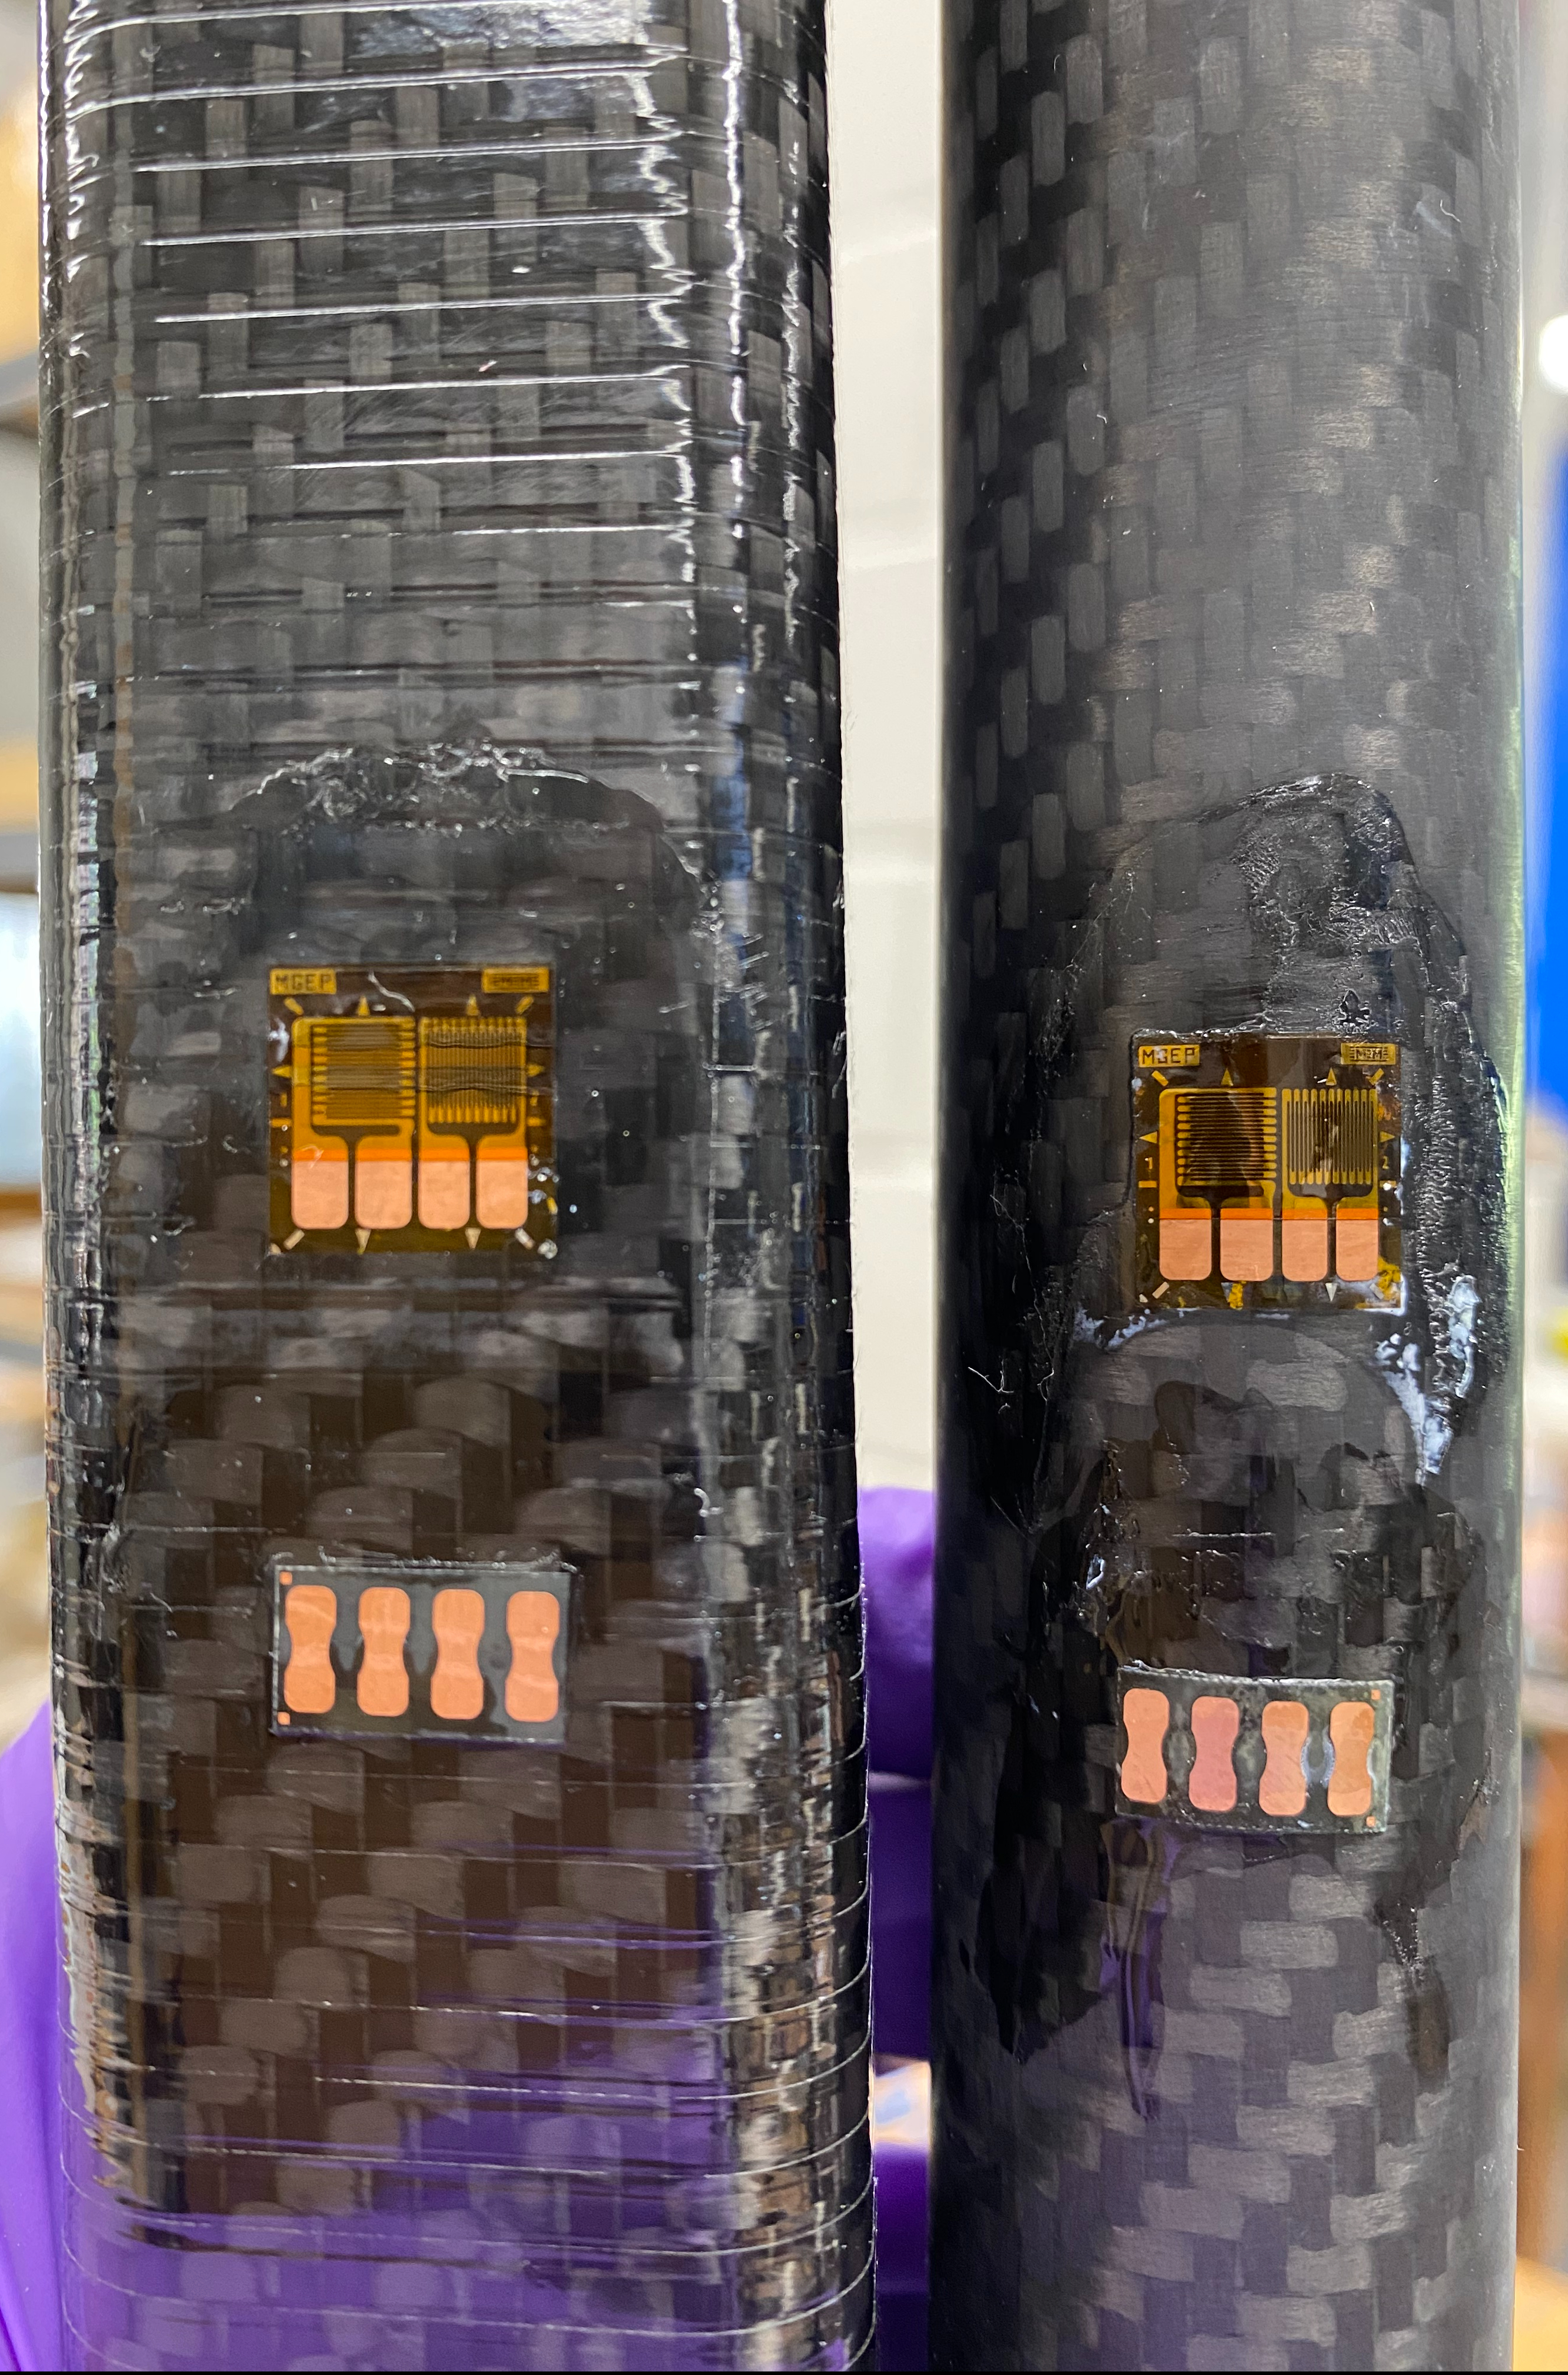
Bottom: A view of the roughened square and circular tubes and their corresponding lugs.
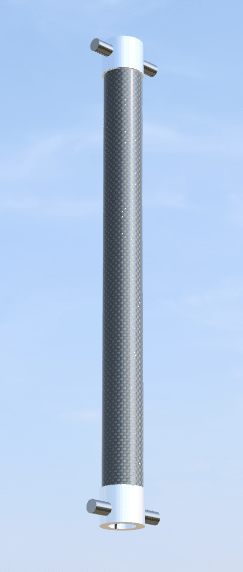
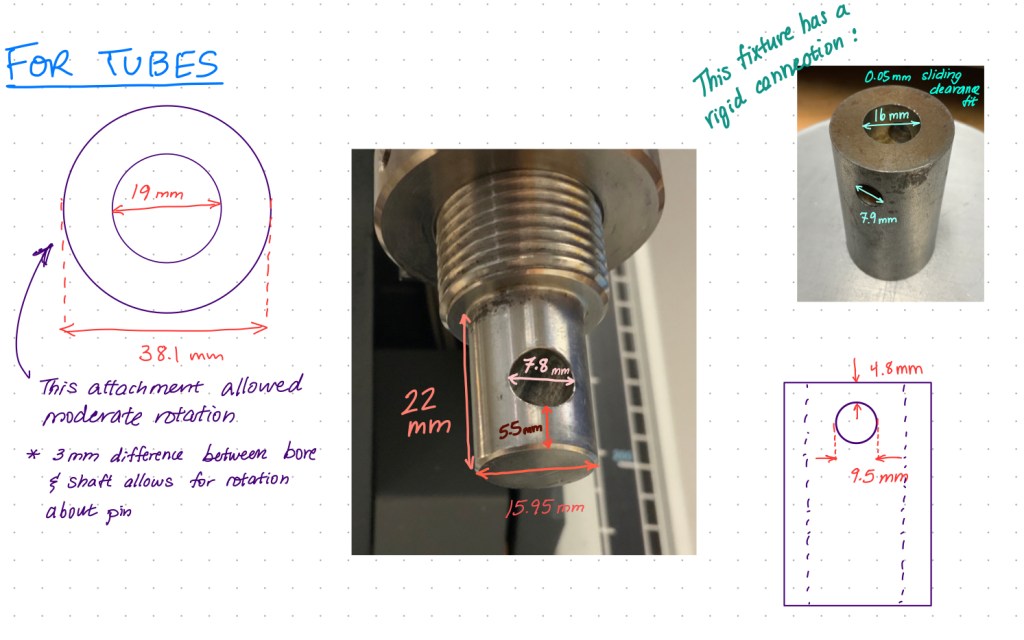
Given the testing load and load cell machine decisions made according to the basic force analysis above, it was then possible develop an appropriate testing attachment system for the tubes. The current configuration of Duke University’s Lloyd Ametek 5kN Testing Machine is a pinned connection. Given the dimensions of the pin and the testing machine connection component (see the figure on the left), I designed two lugs to be epoxied into the ends of each tube.
Machined from 6061 Aluminum, these lugs are designed to allow around 10° of rotation around the pin axis on each end, while transferring compressive load and preventing horizontal translation. I used both the CNC mill and lathe to produce these lugs with a free running fit tolerance between the lug OD and the tube ID to allow adequate space for epoxy. After sanding the lower 1″ of each lug with 100 grit sandpaper for several minutes, the surface was ready for adhesive (see photo on the left).
I used a J-B Weld Adhesive purchased from McMaster Carr with good composite material compatibility to adhere the aluminum lugs to the tubes. I allowed the epoxy to cure for 40 hours before testing.
Takeaways
The main takeaway gleaned from the machining process is that the cylindrical lug required a shoulder in order to prevent slipping during testing. I had only faced off the 1″ OD on the cylindrical lug using 1″ stock rod, however the testing would have ultimately been more successful if I had started with 1.5″ or 2″ dia. stock aluminum and included a shoulder.
3. Developing the DAQ system
The Lloyd Instruments Ametek 5kN testing machine outputs load (N) and deflection (mm) over time (s) in a ‘.txt’ file via the NEXYGEN™ Plus Materials Testing Software. This aspect of the data collection is simple and does not require much additional prep, with the exception of calibrating the testing machine to zero the load and displacement. The Nexygen Software is capable of calculating stresses and young’s modulus when additional information is added to the testing file, such as cross sectional area of the sample. However, these calculations can also easily be performed in Matlab after the fact, and only the load (N) and time (S) data is necessary for basic analysis performed below.
Data collection using strain gauges is not as simple, but can be easily achieved with proper strain gauge application, the use of a Wheatstone bridge circuit, and a data collection software such as National Instrument’s LAB view software. I followed a T-strain gauge application procedure adapted from the document below:
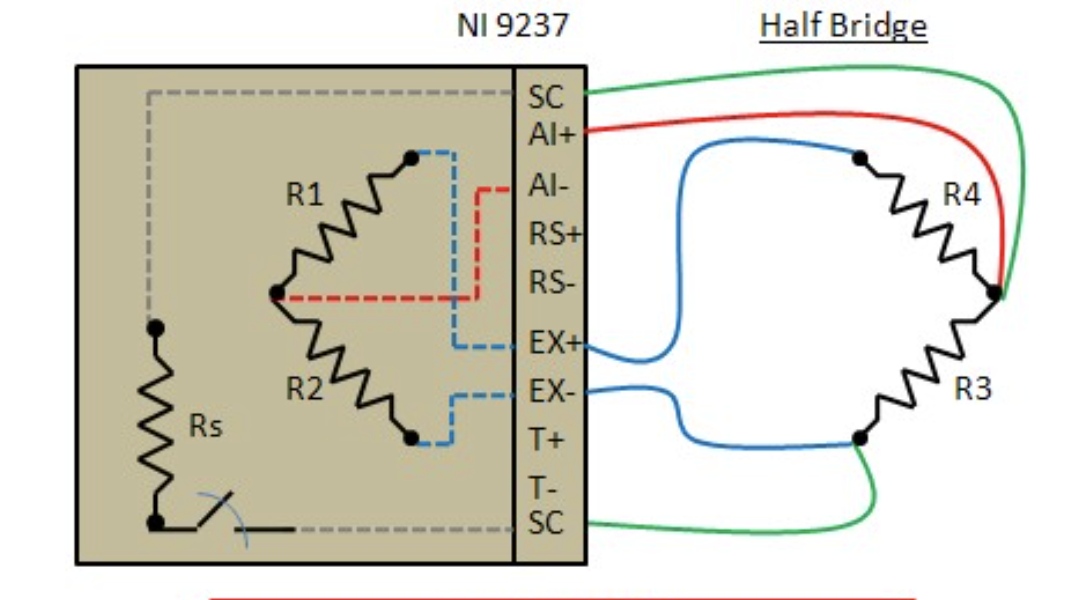
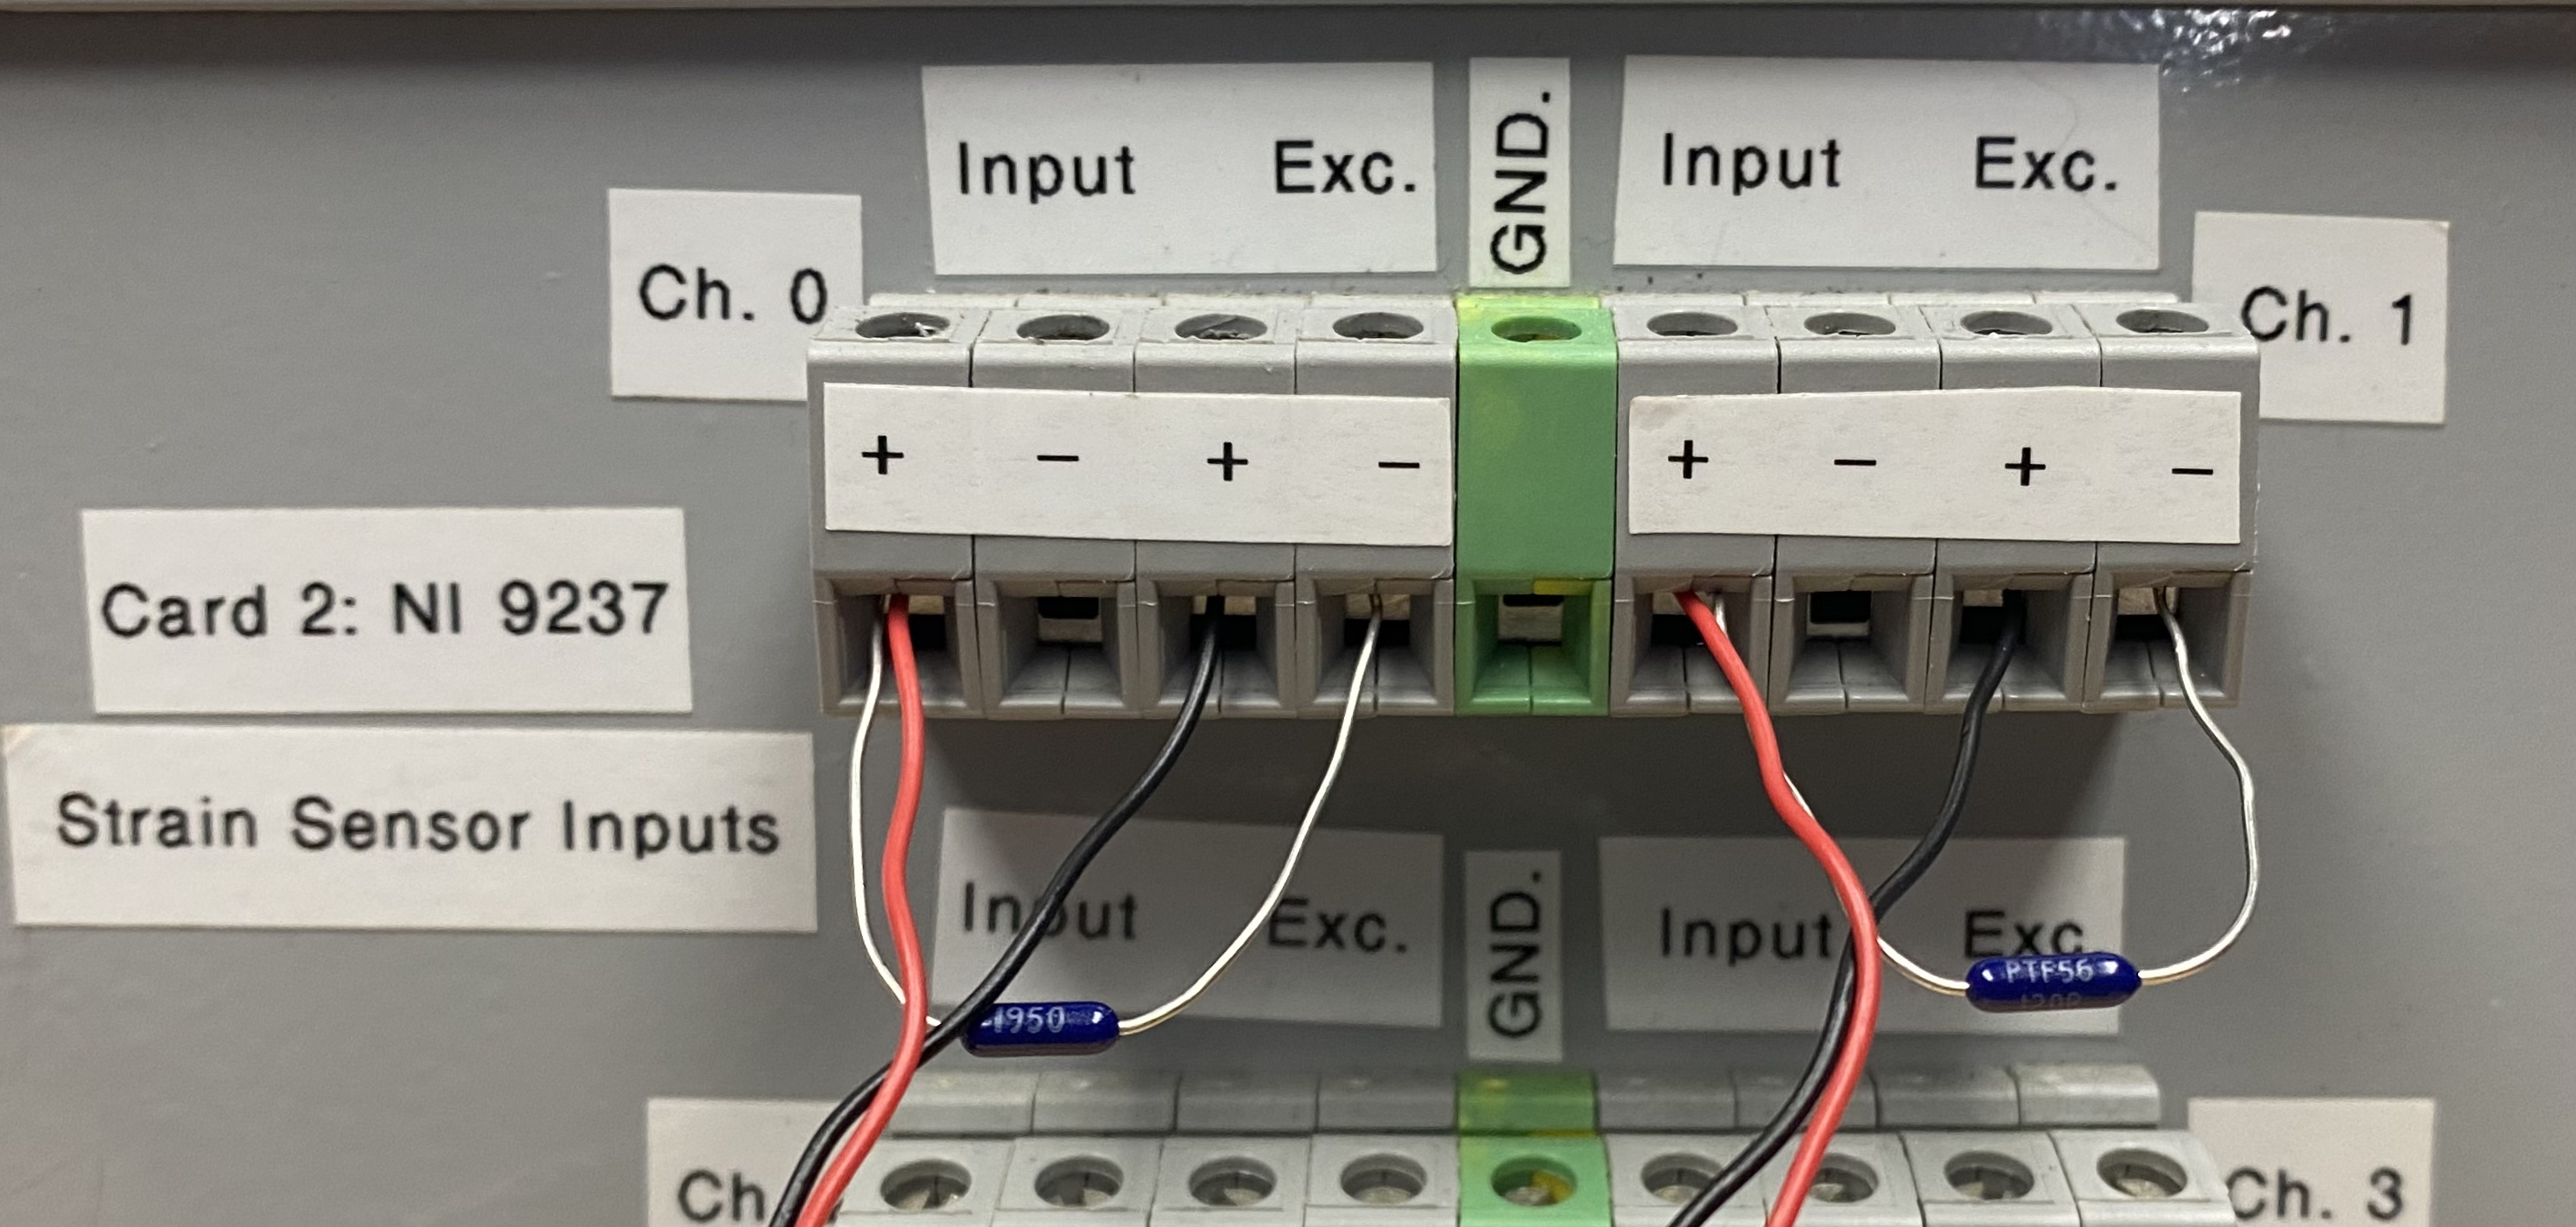
Top Left: The quarter bridge II circuit diagram used to develop the physical circuit in the National Instruments DAQ box on the bottom left.
Right: The applied T-strain gauges and their ports.
Next, I used the Quarter Bridge II diagram above to develop a physical circuit in conjunction with an NI 9237 bridge completion card. The basics of a Wheatstone bridge circuit can be found here and here. For a T-rosette gauge, there are two strain gauges oriented orthogonally. As each strain gauge in the T-configuration has only one output, and there are two strain gauges per tube, I created two Quarter Bridge circuits. Using the circuit diagram above, R4 is the strain gauge input and R3 is a 120 Ω resistor. The gauge factor listed is 2.08, and I selected a Poisson’s ratio of 0.1 according to Sandia National Lab’s 2018 Report on the Mechanical Properties of Woven Composites at Ambient Temperature.
I input these details into the NI LABview interface and selected the appropriate channels, Ch. 0 and Ch. 1, corresponding to the NI 9237 DAQ box to ensure successful transfer between the data card and LABview. To collect both load and strain data, I initiated data collection in LABview before quickly beginning the compression testing procedure in the Nexygen Software. Given the inherent stiffness of CFRP, I set the loading rate to a slow 1mm/minute to prevent the load from increasing to quickly, and maintaining the effect of a static test rather than a dynamic or impact test.
Although there are indeed two separate data streams, it was fairly simple to re-align the data sets during post-processing in Matlab by observing where the strain values deviate from their steady-state values, and where the force exerted onto the pinned connection begins to increase. The data files were cut to contain only these points.
4. Analyzing Results
Given the constitutive relation relating a material’s modulus of elasticity to the ratio of applied stress over resulting strain, shown below.

This relation can be applied to both tensile and compressive stresses, and is therefore a useful tool in analyzing the collected load and strain data. To calculate the compressive modulus of elasticity, or young’s modulus, for each tube, it is first necessary to plot the resulting stress-strain curve, shown here. From this plot, it is possible to identify the linear portion of the curve corresponding to elastic deformation in the material. Due to the extremely low loads used in testing, the resulting data will fall solely within this linear pattern.
To develop the comparative stress-strain curves shown here, I completed the following steps:
- Data Management: Collect and import the .dat and .txt data files in one folder or repository. Begin a Matlab script (.m) and load both the force and strain files for every test of each tube. Corresponding labeling will help!
- Force Data Selection: The first several points of the force and displacement data will be low steady state values that may even read as negative force values. Index these files such that only the data points collected during the compression test are selected. The stress quantity is achieved by simply dividing all load data points by the cross sectional area of the corresponding tube. This approach is verified by understanding the units of Pascals (Pa), which are comprised of force (N) over area (m2).
- Strain Data Selection: This same approach holds true for the strain values. For a T-rosette, two orthogonal strain gauges output data, and the gauge with foil lines running parallel to the length of the tube will output the material strain due to compression in the correct plane. Identify the parallel strain data, and scan through the data points to understand what the pre-testing steady state value is. Subtract the remaining data points from this initial value, and index the data set to exclude these steady state points and post-test points.
- Plot: With both stress and strain identified, edited, and indexed, plot stress vs. strain, making sure to include the origin (0,0). Using polyfit or cftool, determine the best fit line through the data points and plot both raw data and best fit to confirm its accuracy. Further statistical data analysis can be performed at this point to determine goodness of fit.

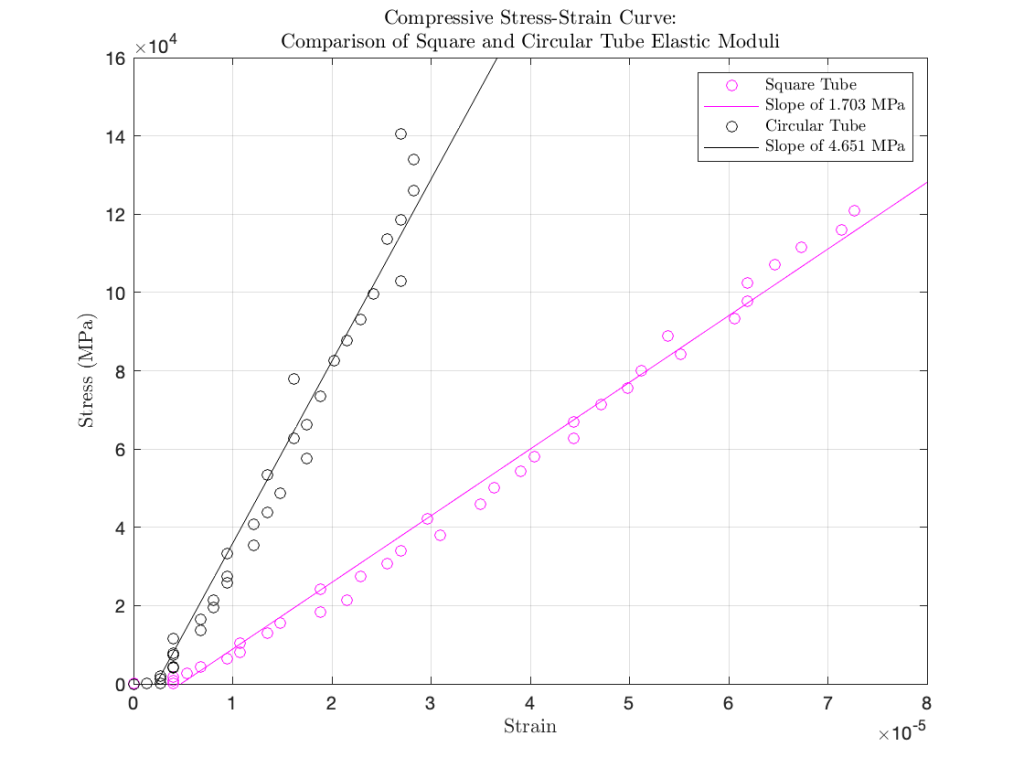
Results and Considerations
Clearly the compressive elastic modulus of the circular tube is higher than that of the square tube. This result is consistent with research on the compressive strength of concrete cubes and cylinders and yet, it seems counter intuitive given the results of the buckling simulations above. This discrepancy seems most likely rooted in the differences between buckling behavior and static loading behavior of hollow tubes. Further compression testing in different materials such as ABS plastic, aluminum, or even another composite such as wood, may shed more light on the behavioral difference between these to loading scenarios for unique geometries.
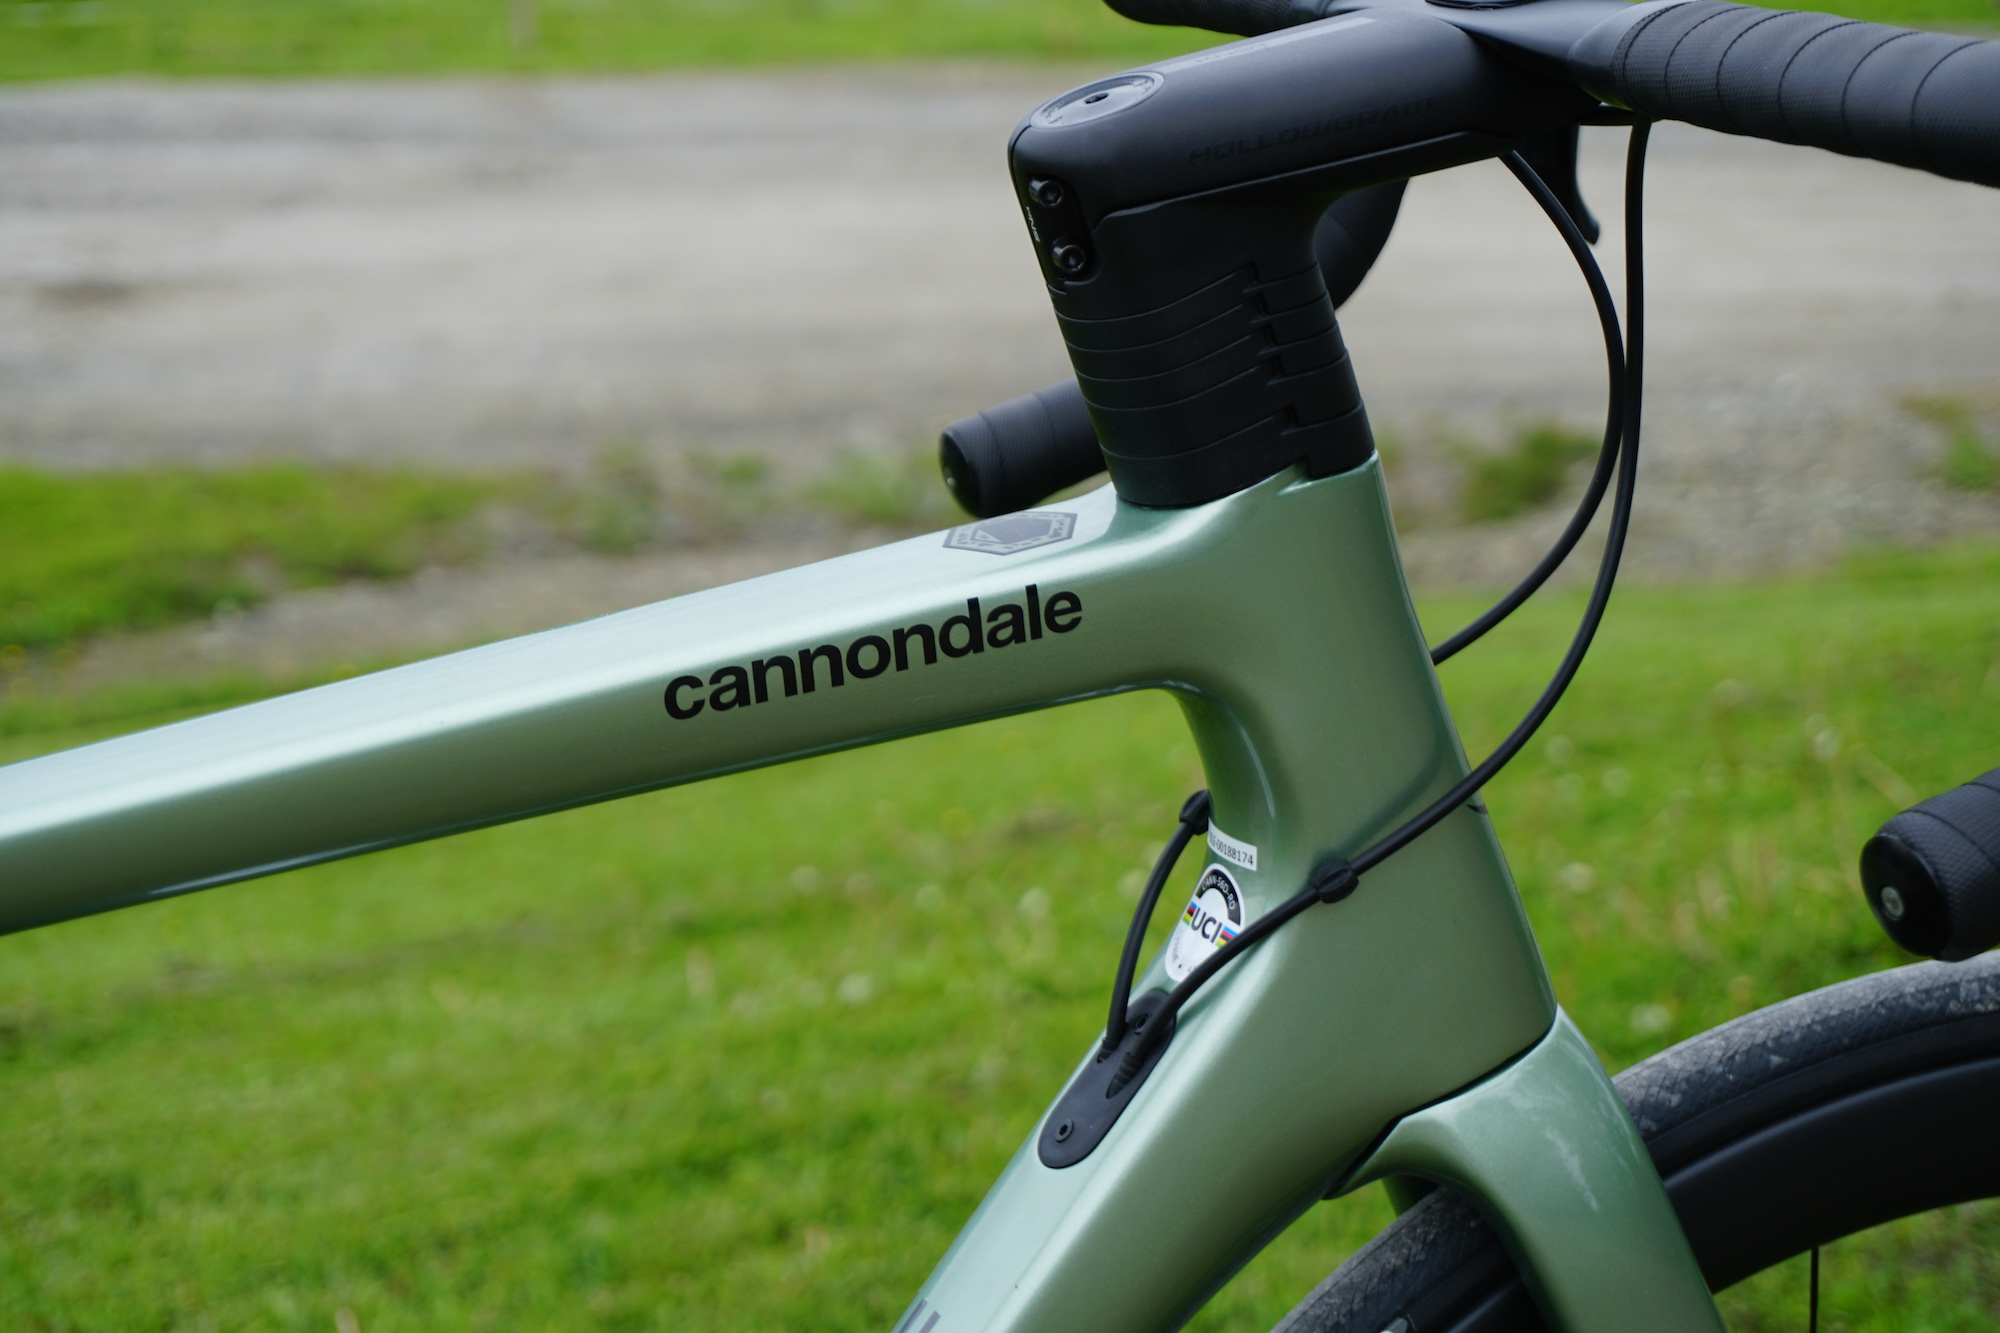
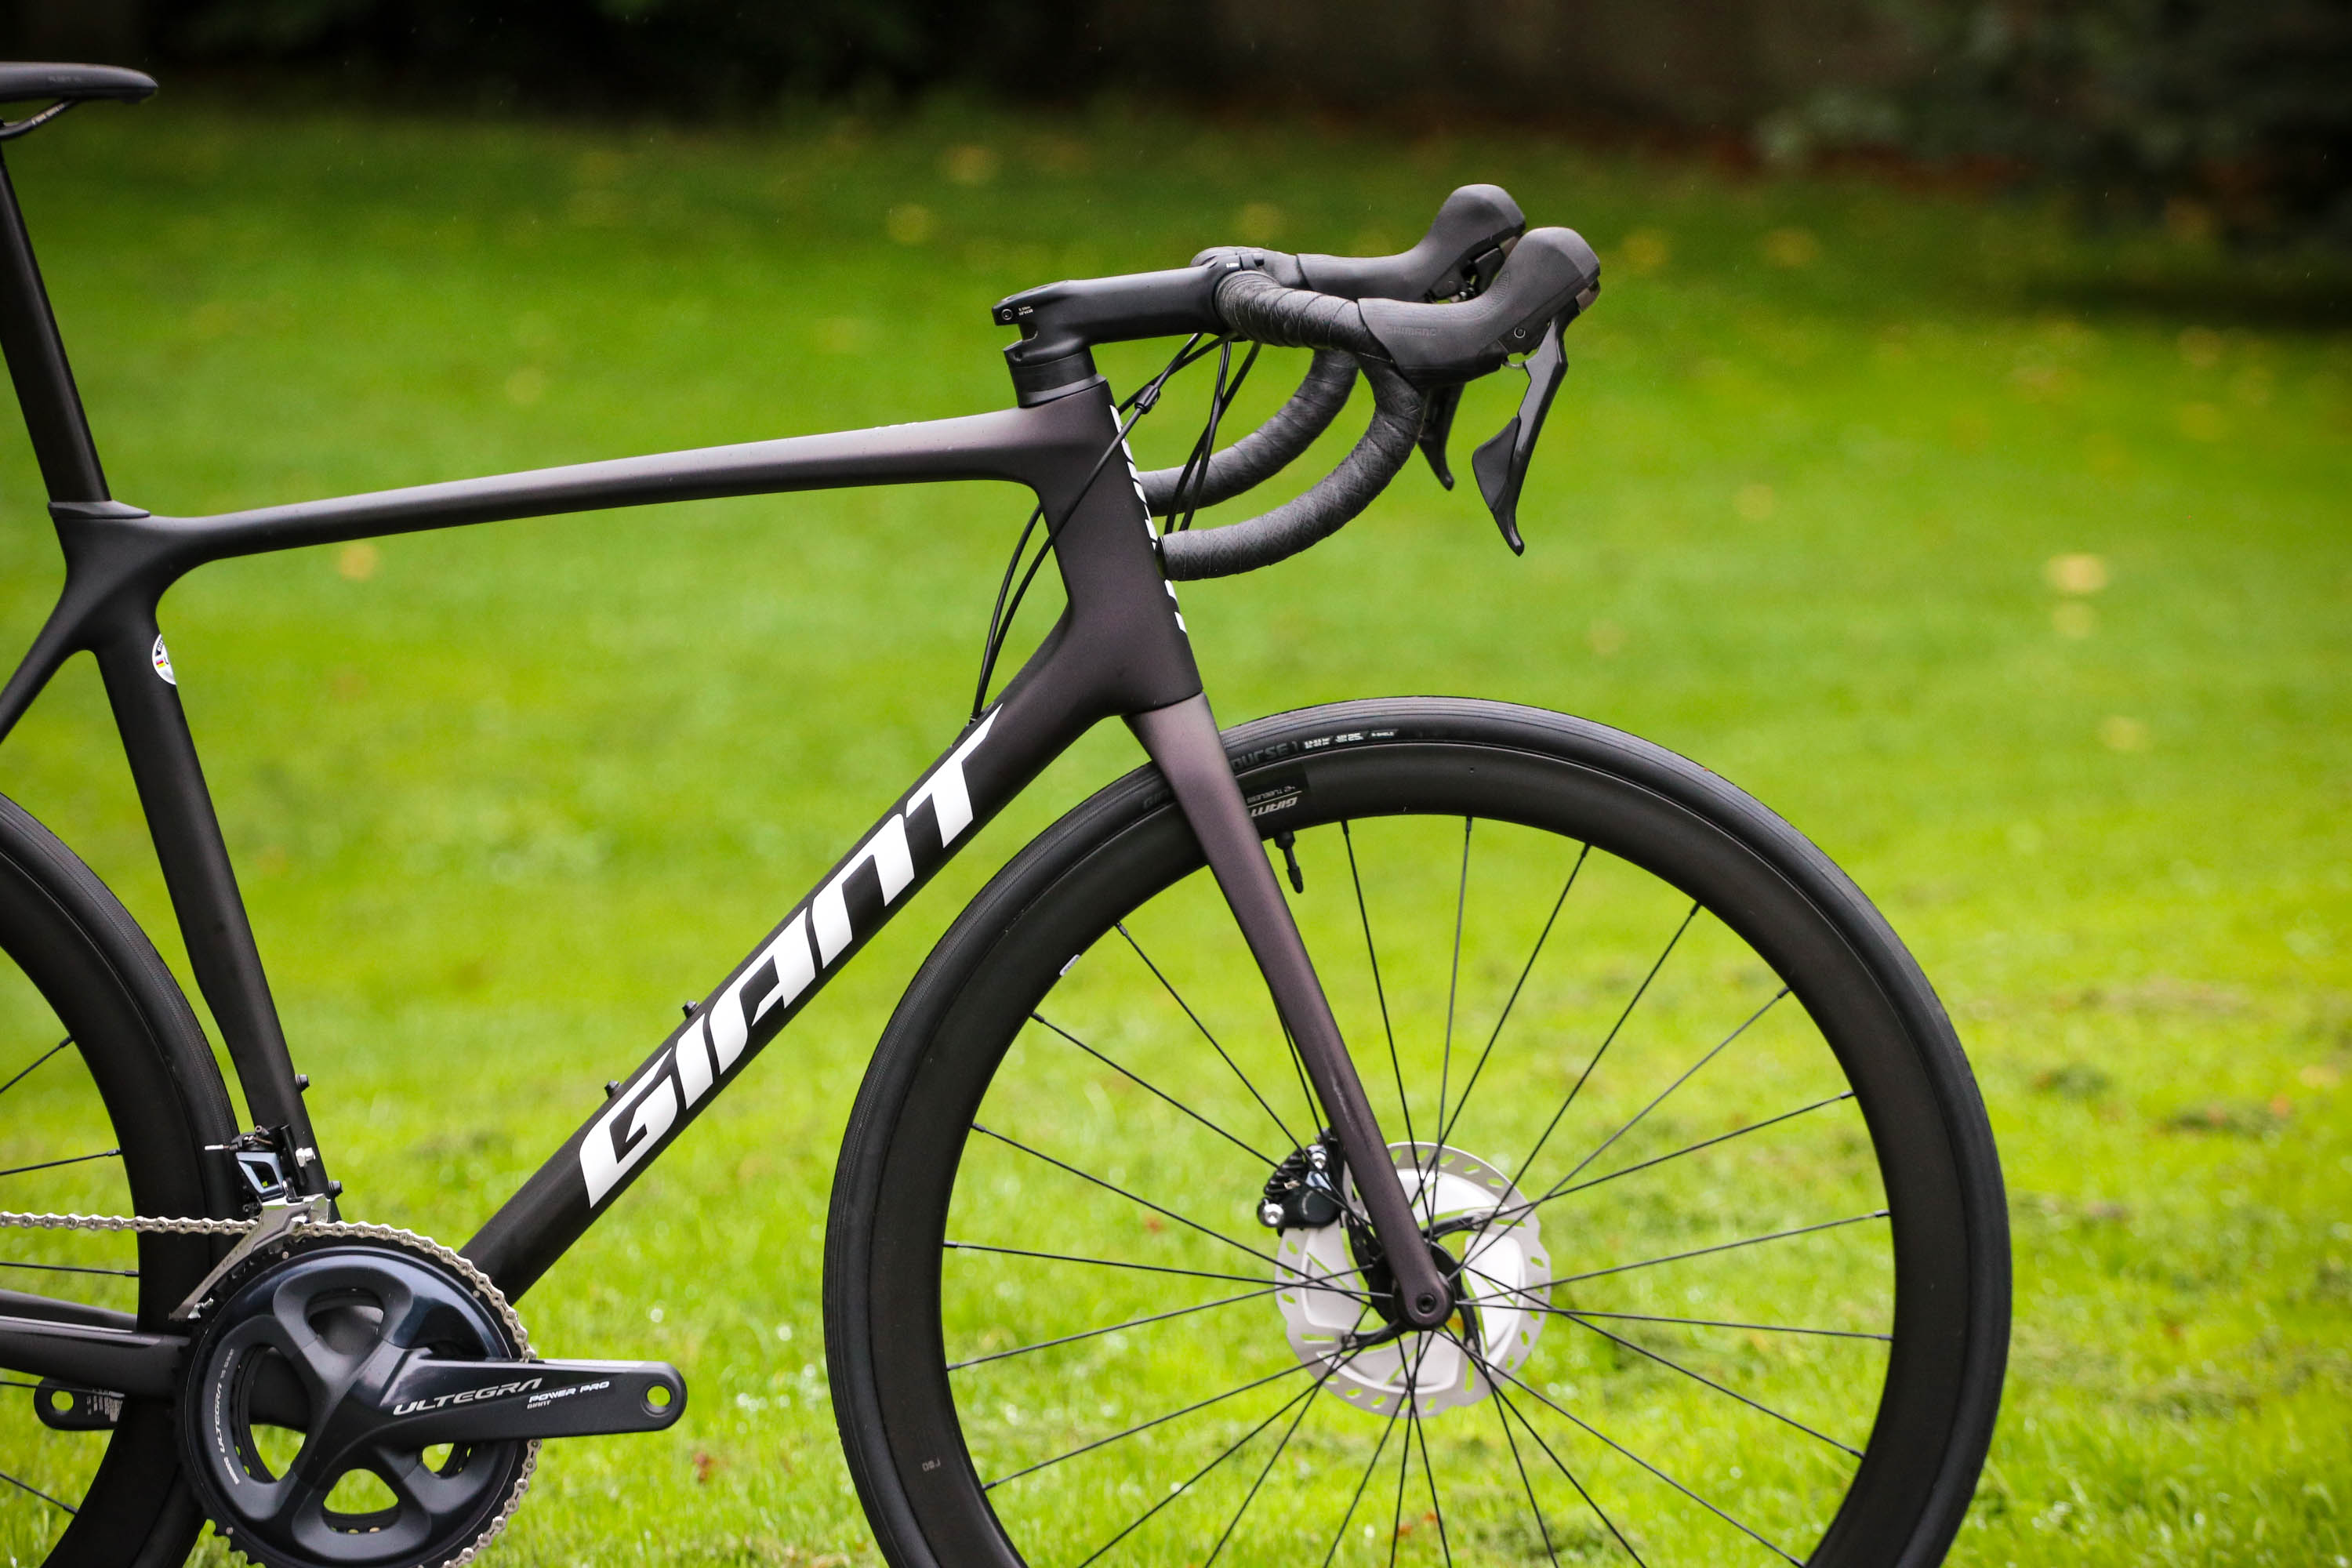
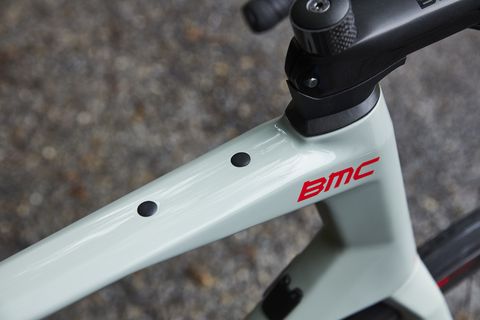
2020 Cannondale SuperSix EVO (left), 2021 Giant TCR (center), 2020 BMC RoadMachine (right)
At the very least, it can be easily understood through this experiment that geometry plays a crucial role in the strength and behavior of tubes. Regarding carbon fiber road bike frame design and analysis, simulations tests such as these must be performed thousands of times with differing ply schedules and loading conditions to ensure that the individual tubes and joints react in the desired way to produce the riding features needed for each individual bike. Clearly as each cyclist has unique preferences about riding comfort and goals, the needs of each frame design change to meet these preferences leading to very distinct frame shapes. Above, notice that Cannondale maintains a rectangular top tube cross section that is proportional to the thickness of its down tube, while Giant opts for a very narrow oval-shaped cross section that is considerably thinner than the down tube. BMC has chosen an even more unique compressed-oval cross section design with a distinct geometric pattern in the head tube. Each of these choices have consequences in how the rider perceives the smoothness, responsiveness, and overall handling.
This process gave me an appreciation for the complexity and time-intensive nature of frame design and validation, and I hope to develop even more appreciation and understanding of this process in future projects.
Future Work
To advance this project, a student could improve the manufacturing process described above, and develop improved carbon fiber tubes with complex cross sections. Lugs for these unique cross sections could be manufactured using Duke University’s Wire EDM cutter in conjunction with traditional CNC machining. Compression testing as well as tension and fatigue testing could be performed to fully characterize the behavior of the unique tubes. In doing so, the unique strength characteristics of said tubes could be determined and this knowledge applied to high end road bike frames in order to better understand internal bike frame loads and how such unique tube shapes are adapted to handle them.
